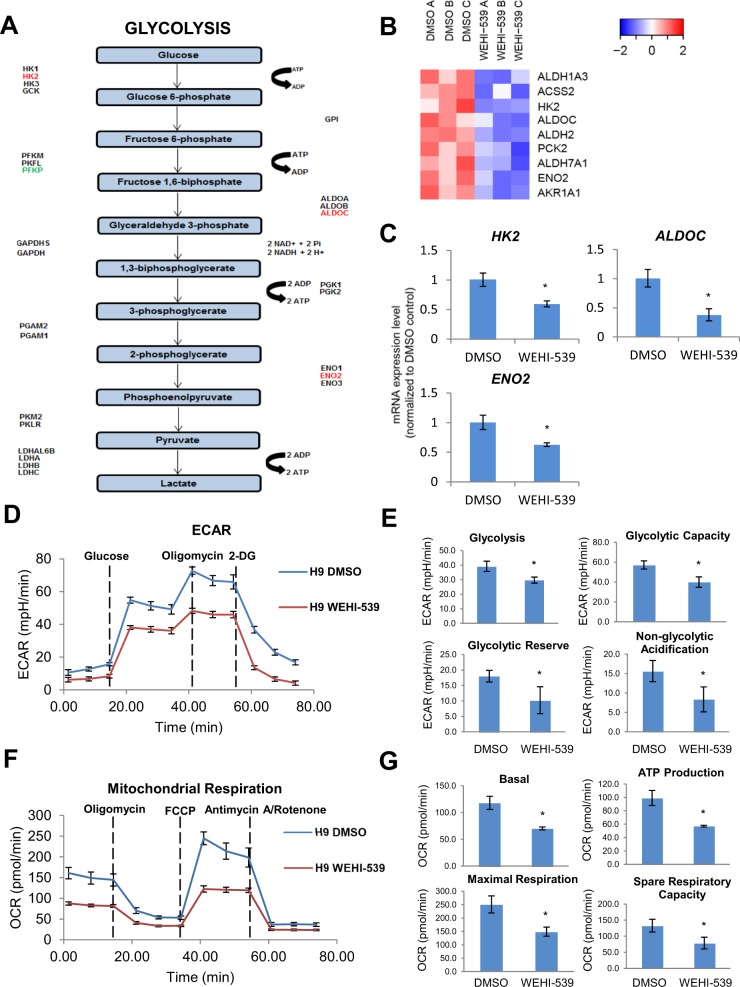
Fig. 5. BCL-xL function contributes to metabolic processes that occur during pancreatic specification.
a Graphical representation of genes perturbed in the glycolysis pathway (upregulation in green and downregulation in red). b Hierarchical clustering heatmap analysis of metabolic genes in D7 cells treated with DMSO or WEHI-539. Colors in the heat map depict gene expression in units of SD from the mean across all samples (upregulation in red and downregulation in blue). c Expression of metabolic gene transcripts upon treatment with WEHI-539 on D7 cells. Error bars indicate standard deviation of three biological replicates undergoing independent differentiations. Asterisk (*) indicates P < 0.05 compared to DMSO control. A representative of at least two independent experiments is shown. d Glycolysis stress test and e individual component graphs of glycolysis, glycolytic capacity, glycolytic reserve, and non-glycolytic acidification in D7 cells treated with DMSO or WEHI-539. f Mitochondrial respiration and g individual component graphs of basal mitochondrial respiration, ATP production, maximal respiration, and spare respiratory capacity in D7 cells treated with DMSO or WEHI-539. Error bars indicate standard deviation of eight replicates. Asterisk (*) indicates P < 0.05 compared to DMSO control. A representative of at least two independent experiments is shown. “See also Figs. S3 and S4”.

