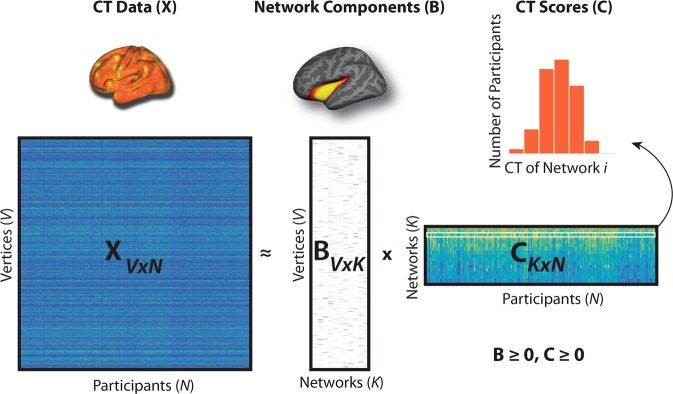
Fig. 1. Non-negative matrix factorization (NMF).
In this figure, X represents the original data matrix as the product of two matrices, B and C. X contains the cortical thickness (CT) data (visualized above the X matrix) for each vertex (rows) and for all participants (columns). B is a matrix that contains, in each column, the loading for each vertex on one of the K networks derived by NMF (an example is visualized above the B matrix). C is a matrix that contains, in each row, the participant-specific coefficients (CT Scores) for each network derived from NMF. The histogram above the C matrix illustrates a sample row of the C matrix with scores for all participants in one network. Both B and C are greater than or equal to 0, thus elements of the factorization are non-negative. Matrices are shown with the following dimensions: V = number of vertices, N = number of participants; K = number of networks.

