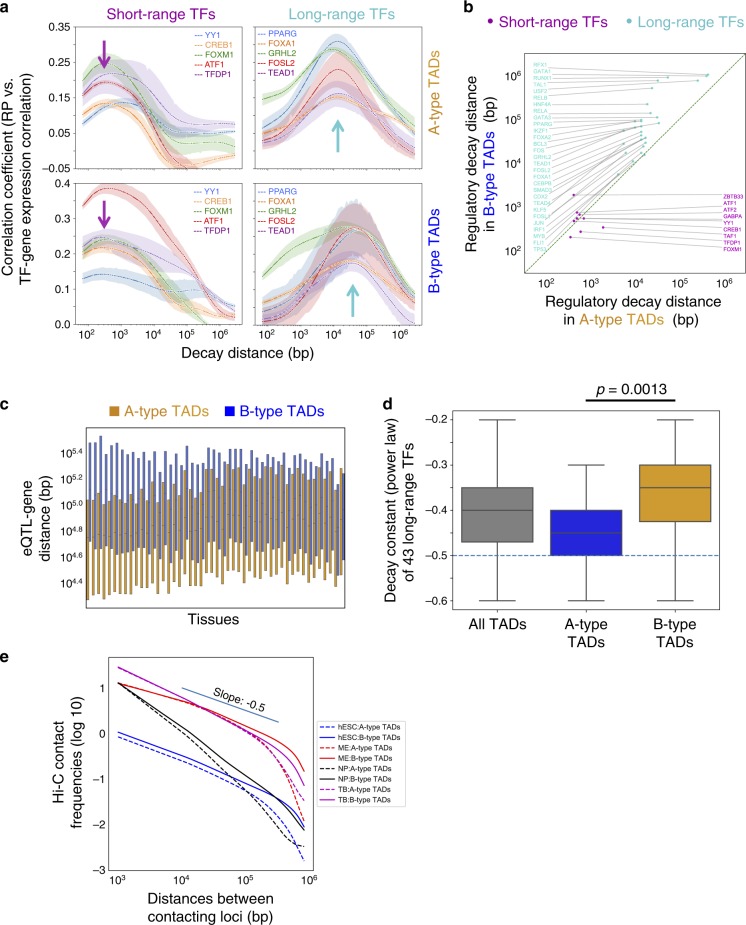
Fig. 4. Long-range TFs have longer regulatory decay distances in B-type TADs.
a–b Long-range TFs have longer regulatory decay distances in B-type TADs than in A-type TADs. c In 47 (out of 48) GTEx tissues, eQTL-TSS distances are longer in B-type (blue) TADs than those in A-type (red) TADs. Tissues were sorted using differential eQTL-TSS distances between A-type and B-type TADs. The box plot extends from the lower to the upper quartile values of the data, with a line at the median. d The power-law decay rates of 49 long-range TFs measured in A-type TADs (−0.4 ~ −0.5) are significantly larger (in terms of absolute magnitude) than those measured in B-type TADs (−0.3 ~ −0.45), (two-sided Student’s t test p value = 0.0013). The box plot extends from the lower to the upper quartile values of the data, with a line at the median. The whiskers extend from the box to show the range of the data. e In human embryonic stem cells (hESC), mesendoderm (ME), neural progenitor (NP), and trophoblast-like (TB) Hi-C data, the average contact frequency between two loci decreases as the distances between the loci increases, following a power-law relationship. In the range of TAD sizes (median size 680 kb), the decay rates are more negative than −0.5. Source data are provided as a Source Data file.

