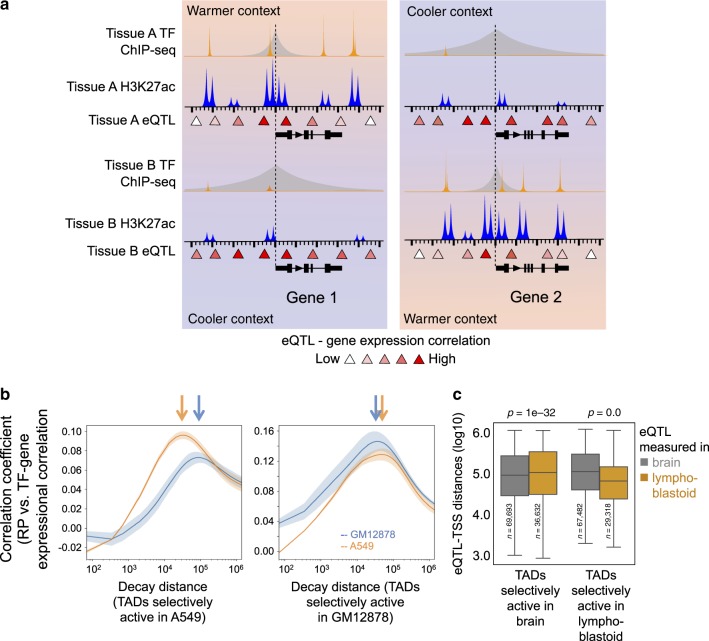
Fig. 5. Regulatory decay distances change with TAD activity and chromatin state.
a Schematic illustration of TF regulatory decay and eQTL-TSS distances decreasing with increasing TAD activity. b The regulatory decay distance of RELA gets shorter as TADs become more active. RELA is expressed in both lymphoblastoid and lung, which possess distinct distributions of active TADs. In the TADs that are more active in lung than in lymphoblastoid cells, the lung-specific RELA regulatory distance is shorter than the lymphoblastoid-specific RELA regulatory distance (left). On the other hand, in the TADs that are more active in lymphoblastoid cells than in lung, the lymphoblastoid-specific RELA regulatory distance is shorter than the lung-specific RELA regulatory distance (right). The lung-specific RELA regulatory decay distance is estimated using RELA ChIP-seq in A549 lung cells and GTEx lung expression data, and the lymphoblastoid-specific RELA regulatory decay distance is estimated using RELA ChIP-seq in GM12878 and GTEx lymphoblastoid expression data. c GTEx eQTL-TSS distances are shorter in the TADs that are more active in the tissues in which the eQTLs are measured. As in b, the distribution of GTEX eQTL-TSS distances measured in brain (gray) or lymphoblastoid (orange) were compared in TADs that are more active in brain than in lymphoblastoid cells and vice versa. Left: TADs more active in brain than in lymphoblastoid. Right: TADs more active in lymphoblastoid than in brain. The different log-transformed eQTL-TSS distances in individual groups of TADs were compared using the two-sided Student’s t test. The box plot extends from the lower to the upper quartile values of the data, with a line at the median. The whiskers extend from the box to show the range of the data. Source data are provided as a Source Data file.

