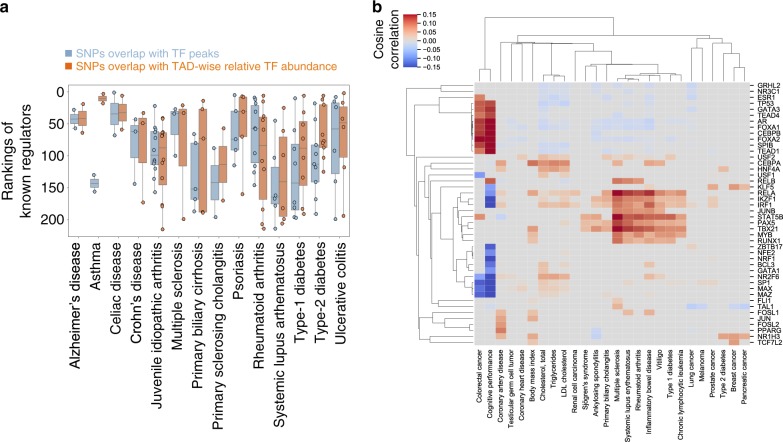
Fig. 6. TAD-wise analysis of non-coding GWAS hits prioritizes relevant TFs.
a Evaluation of the inference of GWAS-SNP relevant TFs on the basis of rankings of known disease-associated TFs. Blue boxes are known disease-associated TFs ranked by overlapping SNPs with TF ChIP-seq peaks, whereas orange boxes are known disease-associated TFs ranked by overlapping SNPs with TADs characterized by different relative TAD-wise TF abundances. The later approach can be approximated as cosine similarities between relative TAD-wise TF occupancies and numbers of disease-associated SNPs in TADs. The two-sided Wilcoxon signed-rank test p value of the paired median TF rankings is 0.005 (n = 14). The box plot extends from the lower to the upper quartile values of the data, with a line at the median. The whiskers extend from the box to show the range of the data. b The heatmap shows the long-range TFs implicated from GWAS SNPs. The x axis represents traits in the GWAS Catalog, especially autoimmune disease, cancers, and metabolic syndromes, and the y axis are inferred long-range TFs. Each entry is the color-coded cosine similarity between relative TF occupancies in TADs and numbers of trait-associated SNPs in TADs. Red squares or blue squares are trait-TF pairs with significantly (p value < 0.001 using one-sided permutation considering multiple hypothesis test) positive or negative cosine similarities, respectively. TFs and traits were clustered using hierarchical clustering. Source data are provided as a Source Data file.

