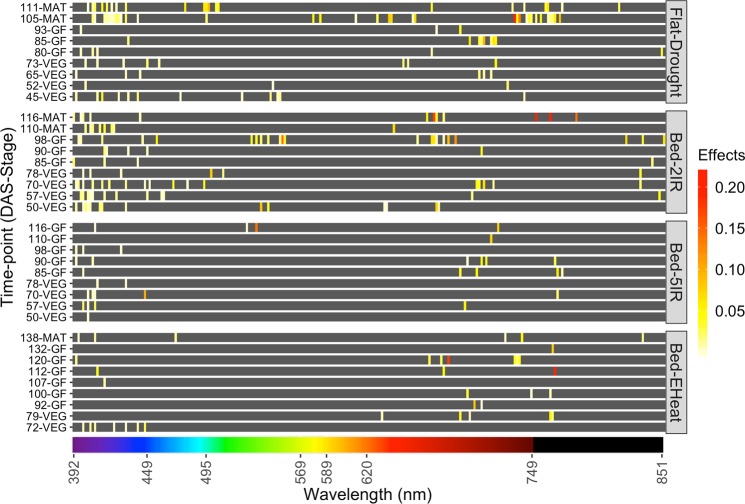
Figure 4.
Heatmap of regression coefficients for L1-penalized selection indices. Separate indices were derived for each environment using multi time-point data. DAS = days after sowing, VEG, GF, MAT represent vegetative, grain-filling and maturity stages, respectively. The bottom color-bar shows the light color associated with each waveband in the visible spectrum (≤750 m); black was used to represent the near-infrared spectrum (wavelength > 750 nm).

