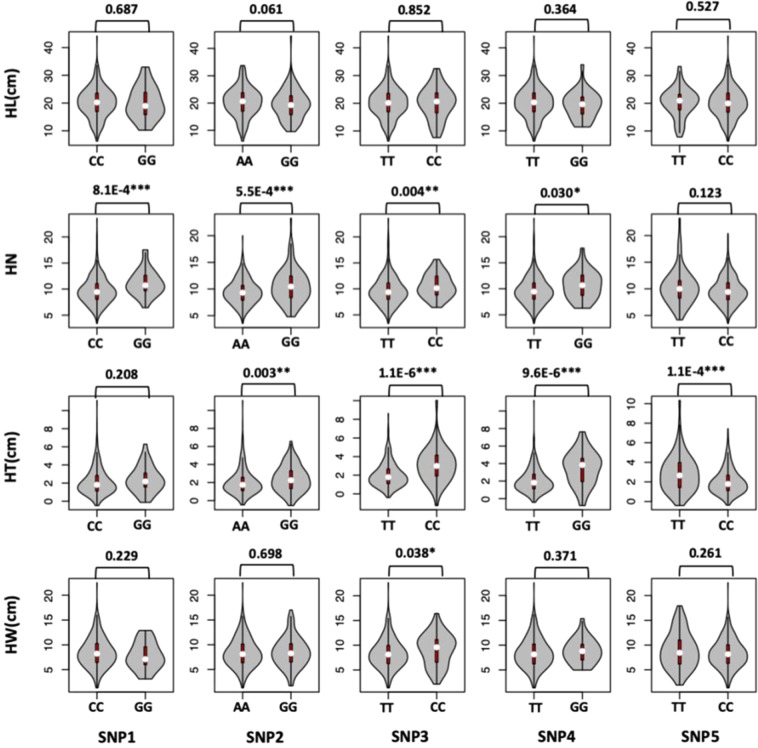
Figure 2.
Violin plots of allelic effects of five SNPs associated with husk traits. In a violin plot, the inner red box represents the interquartile range. The central white dot represents the median value. The outer gray shape on each side represents all measured data points and the thickness represents the probability density of the data. The P-values of the two allelic effects of the four husk traits [Husk Length (HL), Husk layer Number (HN), Husk Thickness (HT), Husk Width (HW)] are exhibited above each small plot. *Significant at P ≤ 0.05; **Significant at P ≤ 0.01; ***Significant at P ≤ 0.001.

