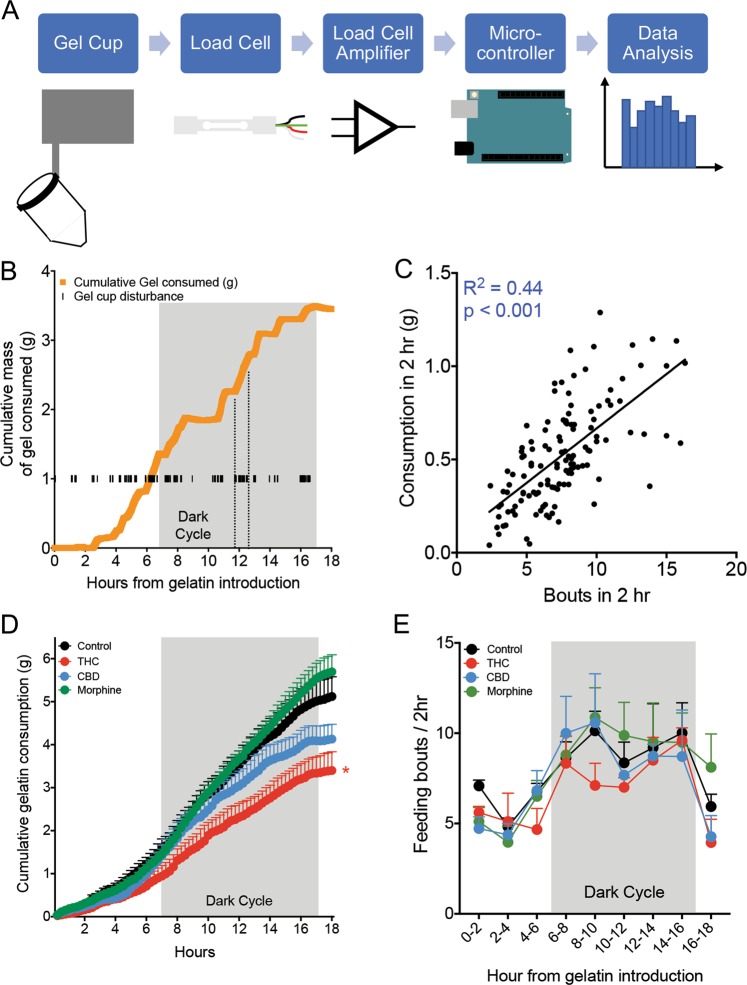
Fig. 2. Microstructure of gelatin consumption.
a Schematic and signal flow of piezoelectric load cell that measures second-by-second consumption and disturbances of the gelatin cup. b Example of cumulative gelatin consumption and disturbances of the gelatin cup over 18 h from one mouse. c Correlation between the number of disturbances of the gelatin cup and the consumption of gelatin in 5 min windows (n = 126 points from 14 animals, p < 0.001). d Average cumulative consumption of the control, THC, CBD, and morphine gelatins over the 18 h measurement period. By 18 h, THC mice showed significantly less cumulative consumption than controls (n = 3–4 mice per group, p = 0.04). e Average number of bouts, defined as a set of disturbances preceded or succeeded by at least 2 min, during 2 h windows throughout the measurement period. There were no differences between the groups in the number of bouts (n = 3–4 mice per group). *p < 0.05, data represent the mean ± SEM.

