FIGURE 5.

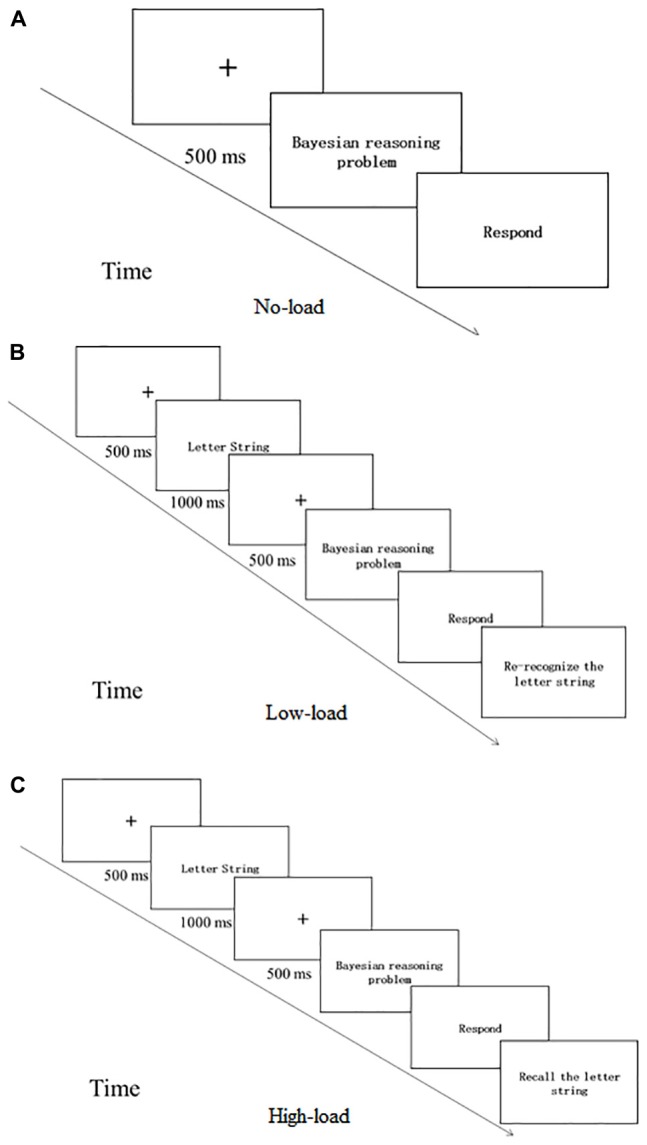
Flow chart of Experiment 2. (A) is for No-load condition, (B) is for the Low-load condition and (C) is for the High-load condition.

Flow chart of Experiment 2. (A) is for No-load condition, (B) is for the Low-load condition and (C) is for the High-load condition.