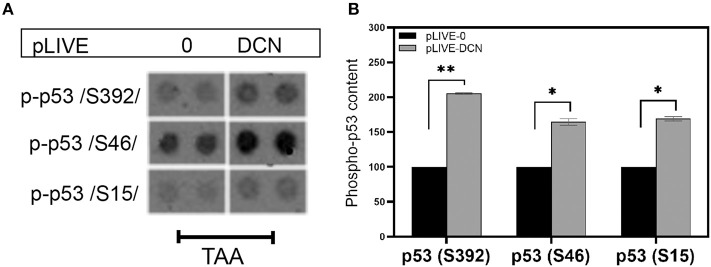
Figure 10.
(A) Changes in phospho-p53/S392/, phospho-p53/S46/, and phospho-p53/S15/ in TA-induced liver cancer. (B) Representative image of the phospho-kinase array dots of different phospho-p53 forms in livers of wild-type (pLIVE-0) and decorin overexpressing (pLIVE-DCN) animals after TA exposure. Column represents the results of densitometry of array dots showing relative levels. All data are demonstrated as mean of normalized ± SD. *p < 0.05; **p < 0.01.

