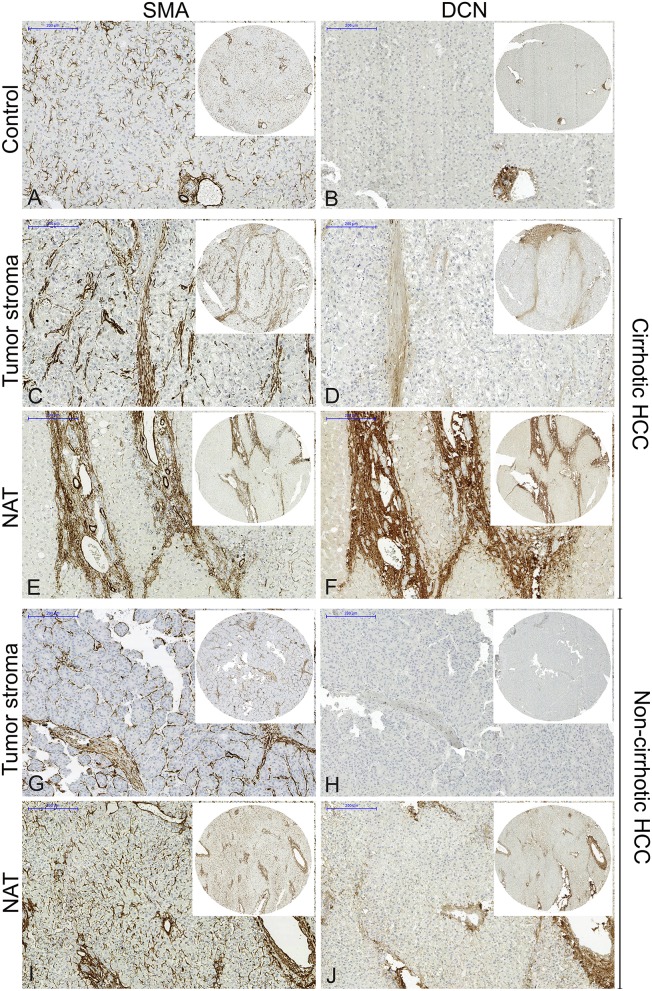
Figure 2.
Representative images of decorin and SMA immunostaining of normal liver (A,B), cirrhotic HCC (C–F), and non-cirrhotic HCC (G–J). From each HCC sample, one core from the tumor and one from NAT tissue was selected. Decreased decorin expression was detected in tumor stroma, compared to NAT both at protein and mRNA levels, which may reflect on the aggressiveness of the HCC. NAT, non-tumorous adjacent tissue; SMA, smooth muscle actin. Scale bar 200 μm. n = 27.

