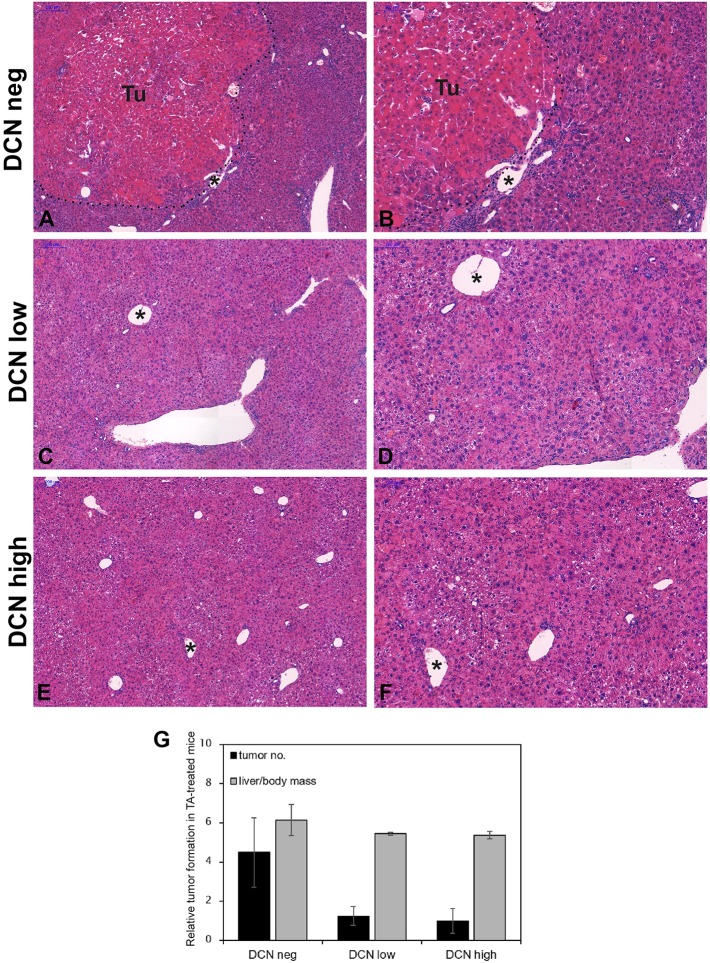
Figure 8.
Representative histological images of hematoxylin and eosin-stained normal (A,B), low (C,D), and high (E,F) decorin expressing liver tissues induced by TA treatment. Tu, tumor; pointed lines indicate tumor border. Asterisks show the same vein in different magnifications. (A,C,E) Scale bar = 200 μm, (B,D,F) 100 μm. Bar charts represent the ratios of tumor-bearing mice in experimental groups of normal, low, and high decorin expressing groups with TA treatment (G). n = 15. All data are indicated as mean of normalized ± SD.

