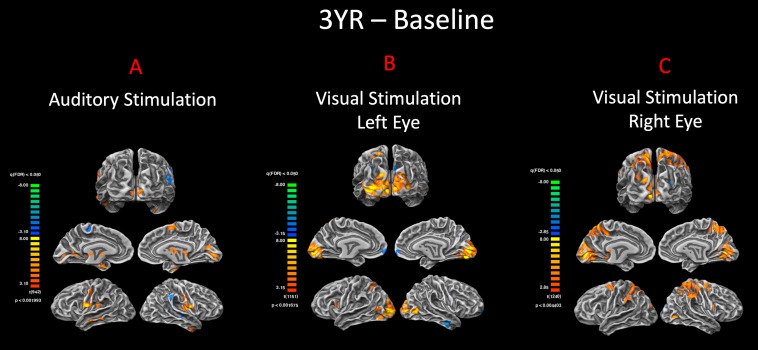
FIGURE 4.
Pre– and post–gene therapy comparison for auditory and visual stimulations. Direct group comparisons of pre– and 3 years post–retinal gene therapy were performed using the FX group-level analysis in response to (A) auditory and (B,C) visual stimulations. Group results are presented at an FDR-corrected p < 0.002 and p < 0.005 for auditory and vision, respectively (q < 0.05). In response to the same auditory stimulation, RPE65 patients showed increased bilateral auditory activation within the auditory cortex, as well as significant level of cross-modal activations along the bilateral calcarine sulci for their 3-year time point. The group comparison of the visual stimulation results between the baseline and 3 years post–gene therapy time points showed significantly more activations in and around the visual cortex for both the left and right eyes (left > right) 3 years after retinal gene therapy.

