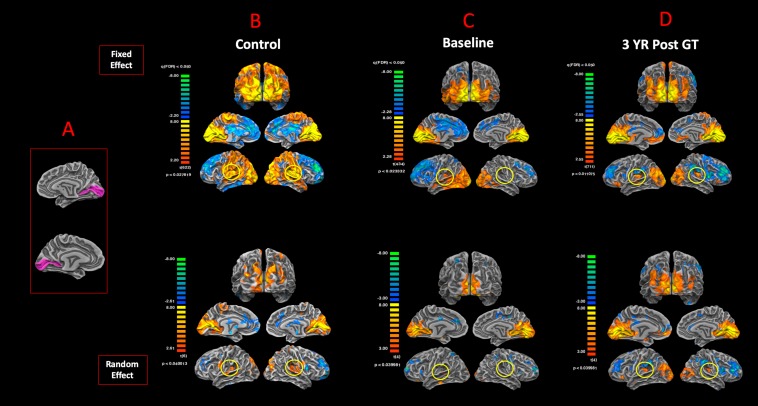
FIGURE 7.
Functional connectivity of the primary visual areas. (A) Left and right Brodmann primary visual areas (BA17) as anatomical seed points for functional connectivity analyses. Results for the FX and RFX group analyses are shown for (B) sighted controls, (C) RPE65 patients at baseline, and (D) RPE65 patients 3 years post–gene therapy. All FX group analyses were performed at FDR-corrected p < 0.02 (q < 0.05), with an extent threshold of >100 mm2, and all RFX analyses were performed at an uncorrected p < 0.04 with an extent threshold >100 mm2. Sighted controls presented significant extended functional connectivity between the left and right BA17 areas and other brain regions, particularly for the primary auditory areas (circled yellow). Connectivity pattern for the RPE65 patients at baseline showed significant functional connectivity across the left and right visual cortex, but considerably reduced levels of connectivity between the primary visual and primary auditory cortices (circled yellow). However, 3 years after gene therapy, functional connectivity between the primary visual to primary auditory cortices significantly increased compared to baseline, but did not reach the same magnitude as observed in sighted controls.

