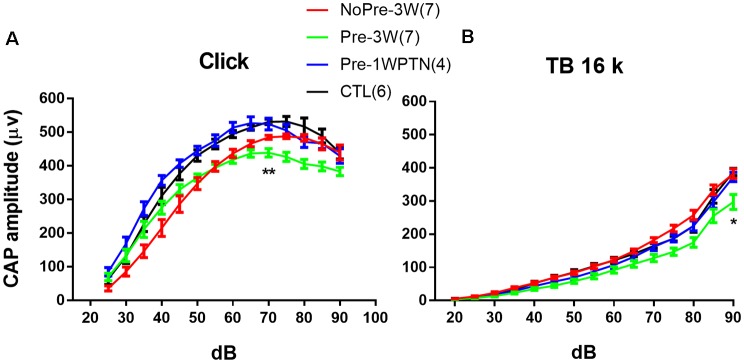
Figure 4.
Compound action potential (CAP) input/output (IO) curves. (A) clicks and (B) 16 k tone bursts. CTL, control group; Pre-1WPTN, 1-week post-toughening noise group; 3W, 3 weeks post-high-level noise; NoPre, group without pre-exposed; Pre, group with pre-exposed. The number of asterisks represents the level of significance (*p < 0.05, **p < 0.01) for the post hoc pairwise tests (Tukey method) against the control group after the two-way ANOVA on the factors of group and level.

