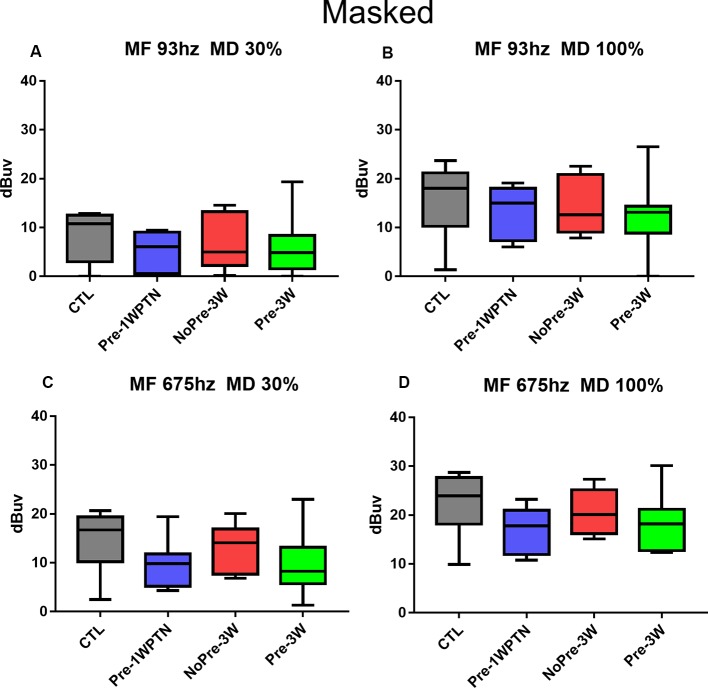
Figure 6.
Comparison of AM CAP amplitude across groups when masking the HP noise. (A–D) AM CAP obtained at different modulation frequencies and depths indicated in the panel titles. CTL, control group; Pre-1WPTN, 1week post-toughening noise group; 3W, 3 weeks post-high-level noise; NoPre, group without pre-exposed; Pre, group with pre-exposed.

