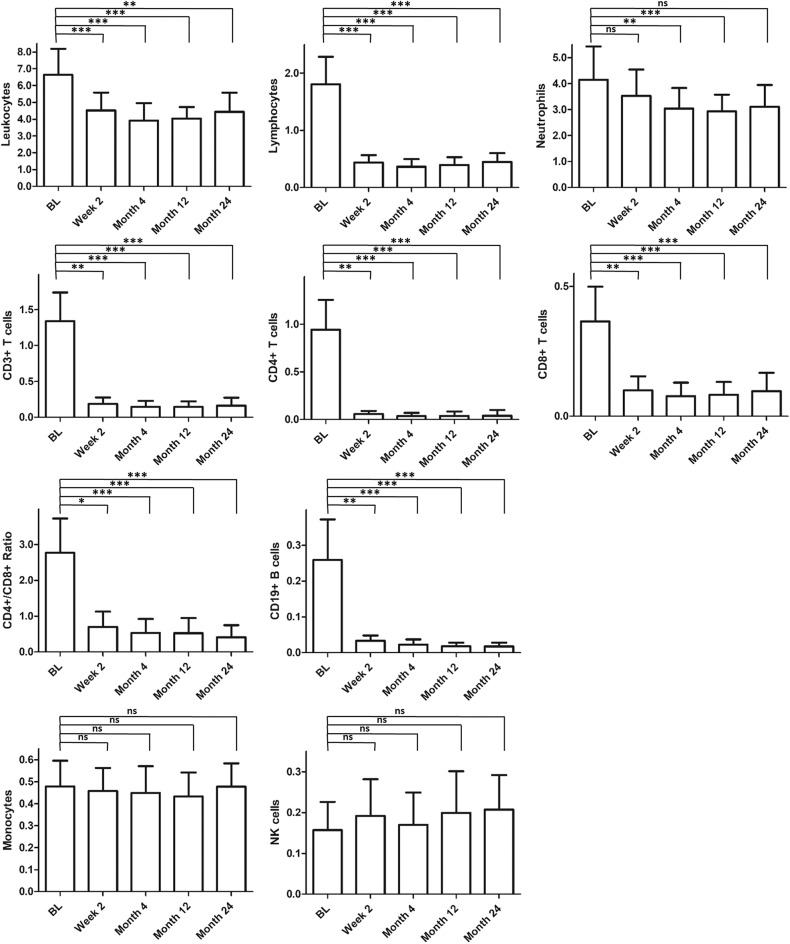
Figure 1.
Long-term effect on immunological parameters. Figured are absolute cell counts [GPt/l] of different immune cell populations within observation period. Mean values and standard derivation at baseline (BL, n = 20) and different time points [2 weeks (n = 20), 4 months (n = 20), 12 months (n = 19), and 24 months (n = 18)] are depicted. For statistical analysis, Friedman test with Dunn's post-test was used. Asterisks indicate level of significance for pairwise comparison (ns, not significant, *p < 0.05, **p < 0.01, ***p < 0.001).

