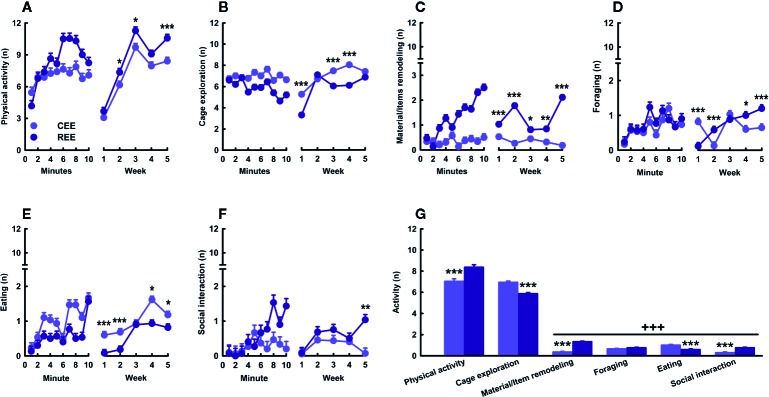
Figure 3.
Behavioral kinetics in the environmental enrichment cage. Physical activity (A), cage exploration (B), material/items remodeling (C), foraging (D), eating (E), and social interaction (F) displayed over minutes (left panels) and weeks (right panels). Cumulative average activity (G). Data correspond to frequencies expressed as mean ± SEM. CEE, continuous environmental enrichment; REE,restricted and unpredictable environmental enrichment. Single, pairwise-comparisons between groups: *p < .05; **p < .01; ***p < .001. Comparison between behaviors: +++ p < .001.

