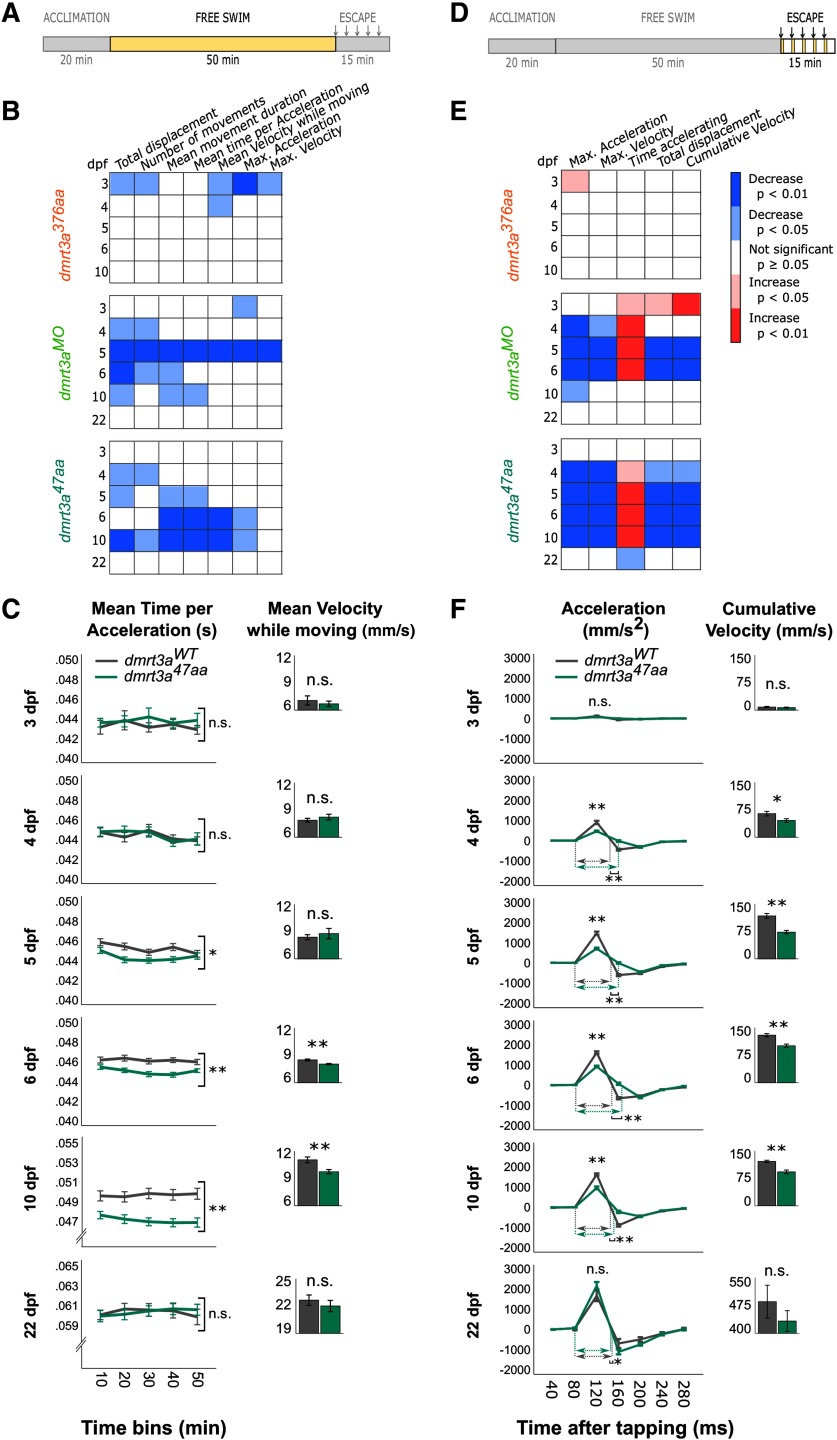
Figure 2.
Comparative locomotor analyses of the three zebrafish models (dmrt3a376aa, dmrt3aMO, and dmrt3a47aa) in relation to their dmrt3aWT. A, D, Schematic of experimental protocol indicates whether data below belong to the free swimming (A) or to the escape response (D); arrows designate timing of taps. B, E, Heat maps to visualize statistical differences among dmrt3a376aa, dmrt3aMO, and dmrt3a47aa in relation to their dmrt3aWT during 1–6 and 10 dpf over the 50 min of free swimming (B) and over the 280 ms of induced escape responses (E). Increase (red) and decrease (blue) of parameters in mutant larvae and morphants compared with dmrt3aWT. C, Mean time per acceleration of dmrt3a47aa and their dmrt3aWT are represented in 10 min bins during free swimming for a dynamic visualization over the trial. However, statistics are performed on the whole trial. Inset, Bar graphs show the mean velocity while moving over the trial. F, Acceleration dynamic of dmrt3a47aa and their dmrt3aWT during escape response in 40 ms bins. Inset, bar graphs show cumulative velocity over the escape. Dashed horizontal arrows indicate the duration of the acceleration phase (in ms) for each group when they are significantly different. All data are plotted as the mean ± SEM. *p < 0.05. **p < 0.01. n.s. - not statistically significant. Statistical data from this figure are shown in Extended Data Figure 2-1.

