
Fig. (1).
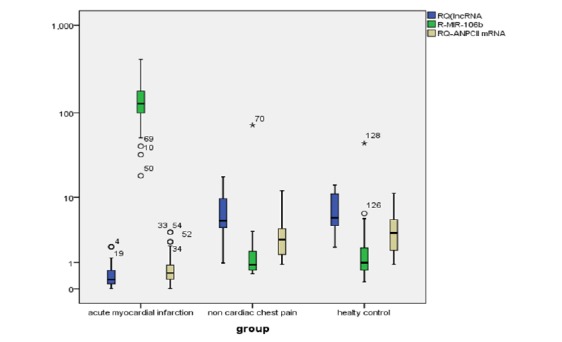
Box plot shows relative expression of the serum RNAs between AMI and control groups. The data is presented as median fold changes (P<0.05).
Official websites use .gov
A
.gov website belongs to an official
government organization in the United States.
Secure .gov websites use HTTPS
A lock (
) or https:// means you've safely
connected to the .gov website. Share sensitive
information only on official, secure websites.
Box plot shows relative expression of the serum RNAs between AMI and control groups. The data is presented as median fold changes (P<0.05).