Fig. (3).

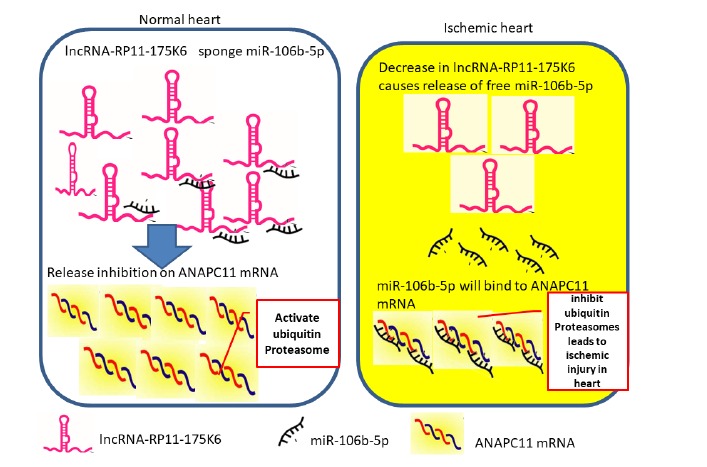
A schematic diagram to map the suggested association between the chosen genes. Schematic diagram of the study hypothesis.

A schematic diagram to map the suggested association between the chosen genes. Schematic diagram of the study hypothesis.