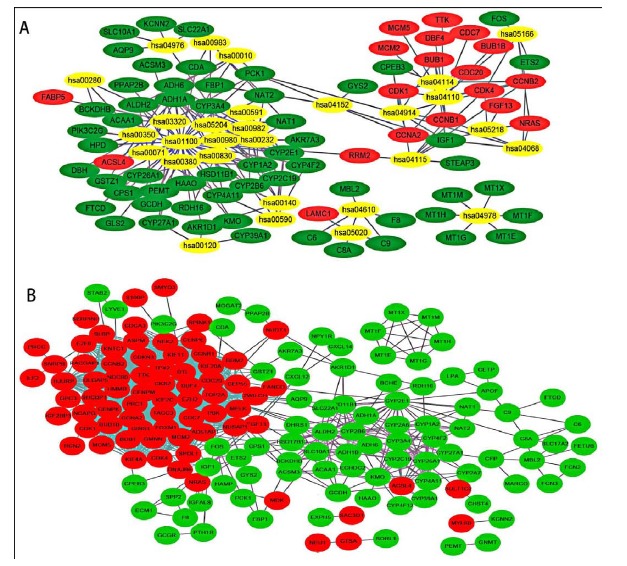
Fig. (4).

The relationship between the enriched KEGG pathways and the DEGs aggregated in GSE45267, GSE60502 and GSE74656 (A) and the protein-protein interaction (PPI) network of the these DEGs (B). Yellow (gray) represents KEGG pathways ID; Red (deep color) nodes indicate up-regulated DEGs; Green (light dark) nodes represent down-regulated DEGs; The lines between nodes represent the interactions between proteins.
