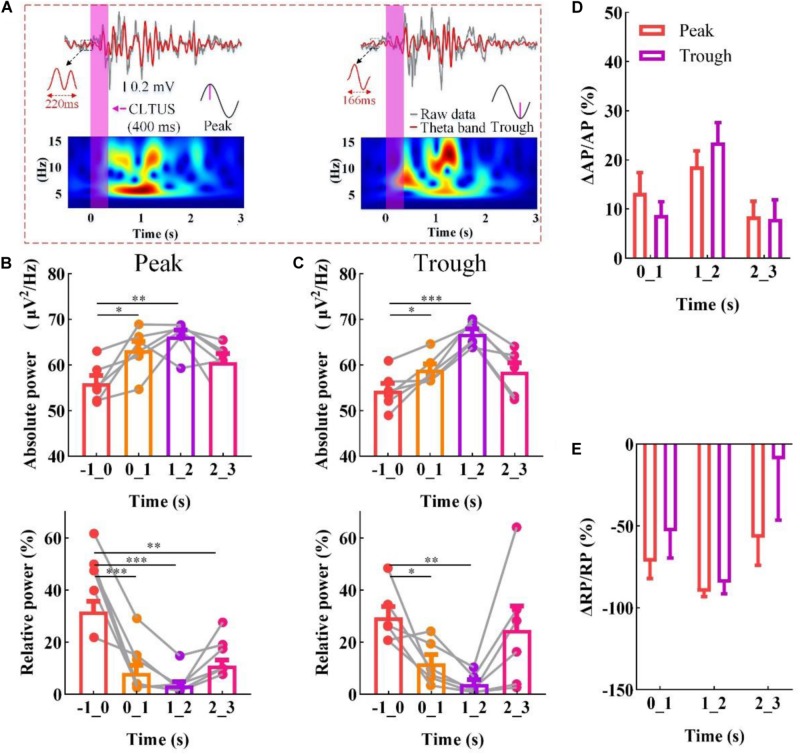
FIGURE 2.
CLTUS for neural oscillation based on the specific phase of the theta rhythm. (A) (top) LFP signals and different phases of the theta rhythm (peak and trough); (bottom) time–frequency diagram of LFP signals (4–16 Hz). (B,C) (top) MAP of the theta rhythm (peak and trough, respectively *p < 0.05, **p < 0.01, ***p < 0.001, N = 6, mean ± SEM, one-way ANOVA); (bottom) RP of the theta rhythm (peak and trough, respectively, *p < 0.05, **p < 0.01, ***p < 0.001, N = 6, mean ± SEM, one-way ANOVA). Changes in (D) AP (ΔAP/AP) and (E) RP (ΔRP/RP) of the theta rhythm upon the CLTUS.

