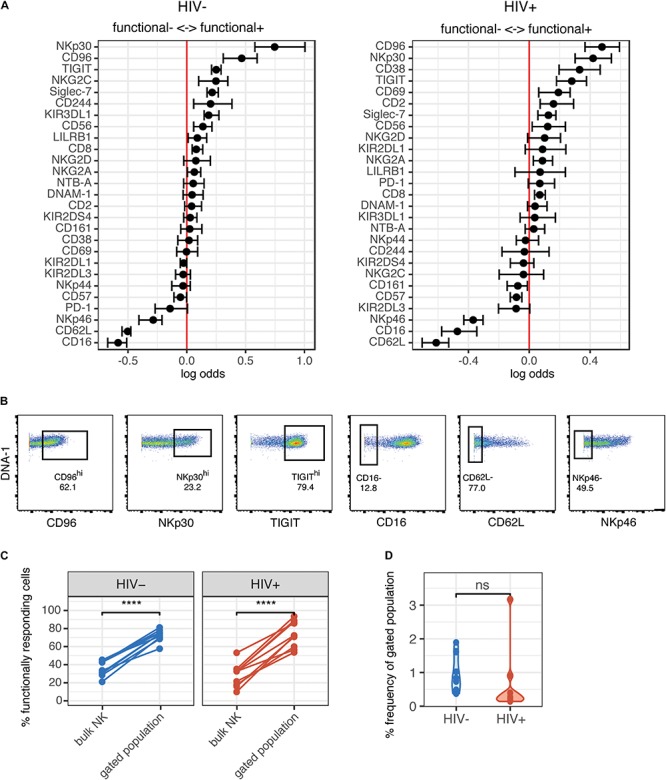
FIGURE 3.

Phenotype of NK cells responding to HIV are similar between HIV- and HIV+ donors, and include many of the markers that are altered in ART-treated HIV infection. (A) A generalized linear model with bootstrap resampling was used to identify NK cell receptors predictive of either functionally responding (right), or non-responding (left) NK cells, in HIV– (n = 10) and HIV+ (n = 10) donors. Log-odds are logarithm of ratios of the probability that a cell belongs to either group. For each marker, the 95% confidence interval is represented by the line surrounding the point estimate; a larger absolute log-odds value of the parameter indicates that the marker is a stronger predictor. (B) Gating on markers that predict functionally responding cells (NKp30hi CD96hi TIGIThi CD62L- CD16- NKp46-), with a minimum log-odds threshold of 0.2 in both groups. (C) Comparison of functional activity in the gated population, compared to bulk NK cells. Summary data of percentage positive functionally responding (positive for any of CD107a, IFN-γ, MIP-1β, and TNF-α) in HIV– (n = 10) and HIV + groups (n = 10). ****p < 0.001, by paired t-test. (D) Comparison of the frequency of the gated population, as a percentage of total NK cells, between the HIV– (n = 10) and HIV+ (n = 10) groups. ns, not significant, by t-test.
