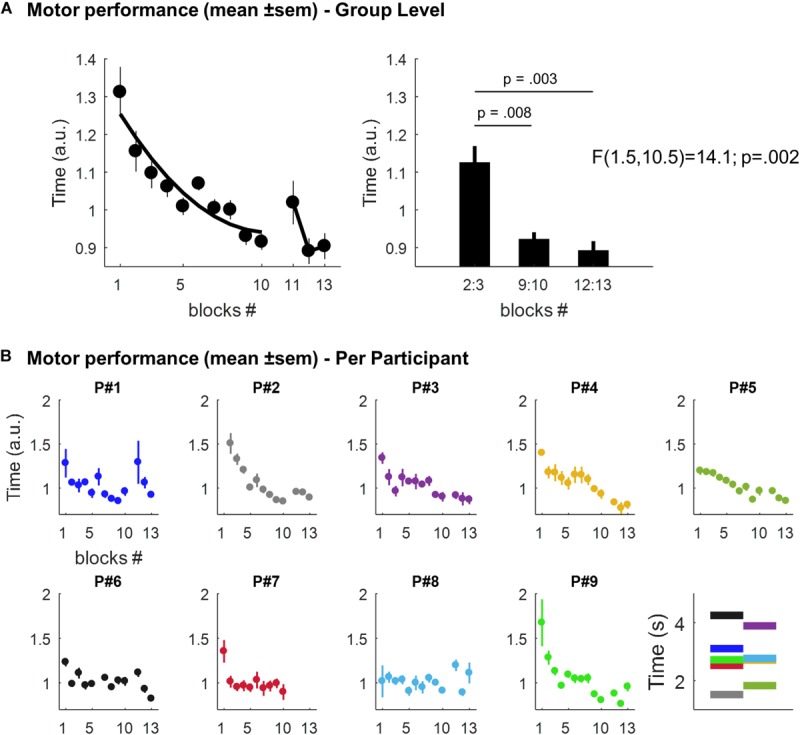
FIGURE 2.

(A) Motor performance at the group level. Left panel: scatter plots (dots) and best second degree polynomial fit (black line) of the mean time (± SEM; arbitrary units, a.u.) to play the 6-digit sequence across the 10-blocks of the learning session and the 3-blocks of the retest, respectively. Right panel: mean time (± SEM; a.u.) to play the sequence in blocks 2:3, 9:10, and 12:13, respectively. (B) Individual motor performances. Scatter plots (dots) of the mean time (± SEM; a.u.) to play the 6-digit sequence across blocks for each participant. The last panel displays, for each participant, the mean performance (in seconds) across all the sequences (mean = 2.81, range: 1.52–4.25). Per participant, each sequence’s repetition was divided by this mean value. This yields performance values expressed relative to a “baseline level”, thus facilitating comparison between participants. Note that motor performance in Participant P#2 was not record during the first block for technical reasons and P#7 declined to run the retest session at the end of the nap session.
