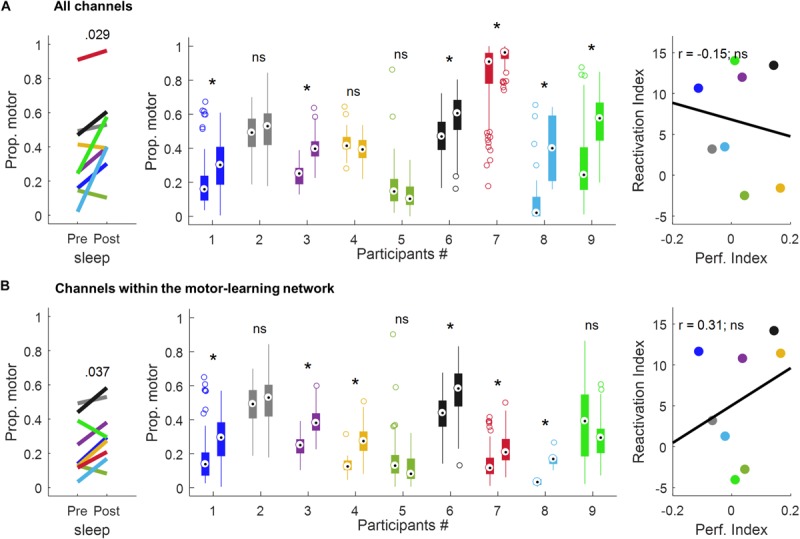
FIGURE 6.

Proportion of motor votes during sleep and correlation with performance improvement using all the channels (A) and the channels within the motor-learning network (B). The left-panel displays the median proportion of motor votes during sleepPre and sleepPost, respectively. The p-value is of a paired-sample t-test (two-tailed, p < 0.05). The middle-panel displays, for each participant and sleep period, boxplots of the proportion of motor-votes within 30 s-long sleepPre and sleepPost NREM sleep epochs (Wilcoxon rank sum test, left-tailed, *p < 0.025). The right-panel displays the correlation between the reactivation index (i.e. difference in the median proportion of motor-votes [Post-Pre] multiplied by the number of sleep epochs in sleepPost) and the performance index (i.e. difference between blocks 9,10 of learning and blocks 12,13 of the retest [blocks9,10-blocks12,13]; Pearson’s r, two-tailed, p < 0.05). ns, non-significant.
