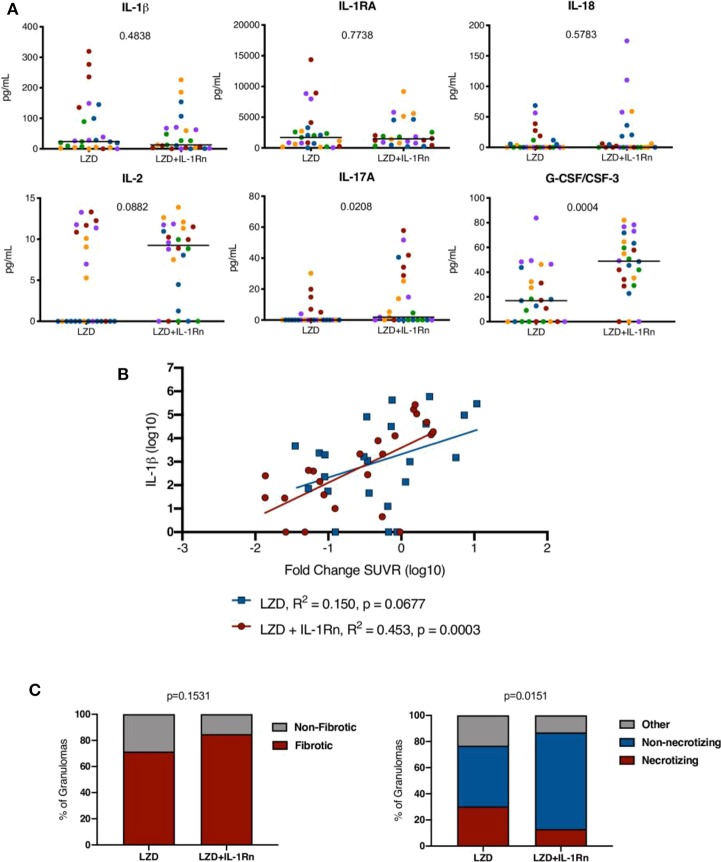
Figure 8.
Inflammation modulation by HDT influences granuloma resolution. (A) Randomly selected granulomas (n = 5 per macaque, n = 25 per treatment group) were subjected to multiplex cytokine analysis to determine differences between treatment groups (colors indicate lesions from a single animal). p-values shown determined by Mann-Whitney test. (B) A linear regression analysis of IL-1β levels and fold change in SUVR is depicted for LZD (blue) and LZD+IL-1Rn (red) granulomas. R2 and p-values are provided in the legend. (C) Granulomas from LZD (n = 57) and LZD+IL-1Rn (n = 45) were examined by a pathologist (EK) and categorized. We compared fibrotic (red) vs. non-fibrotic (gray) (left) frequencies between treatment groups. The right compares necrotizing (red) vs. non-necrotizing (blue) and other (gray) granuloma frequencies. Fisher's exact test p-values are reported.

