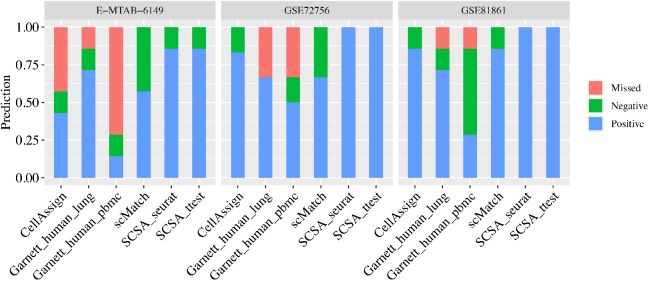
Figure 2.
Performance of SCSA in comparison with other methods (scMatch, CellAssign, and Garnett) based on three known cell type datasets. Dataset identity was labeled on top of the panel with cluster numbers in brackets. For legends, “Positive” meant percentage of correctly predicted clusters, while “Negative” meant incorrectly predicted clusters and “Missed” meant predictions with uncertain cell types.

