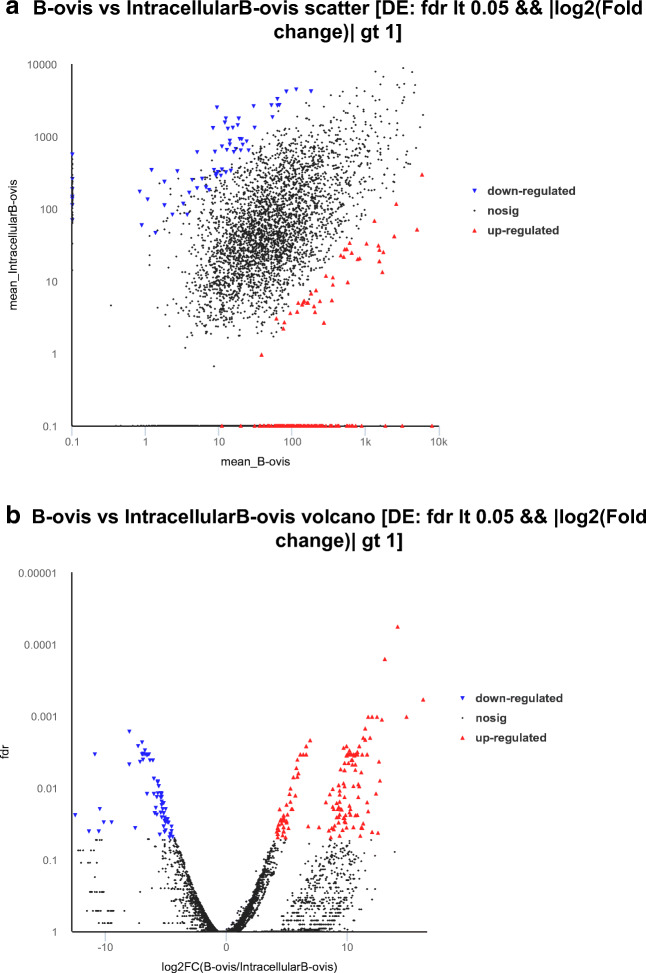
Fig. 1.
Visual analysis of DEGs. a Scatter diagram of DEGs between wild-type and intracellular B. ovis. The red dots indicate genes that were significantly upregulated, blue dots indicate genes that were significantly downregulated, and black dots indicate genes that were not significantly different. b Volcano plot of DEGs between wild-type and intracellular B. ovis. The red dots represent significantly upregulated genes, blue dots represent significantly downregulated genes, and black dots represent non-significant genes.

