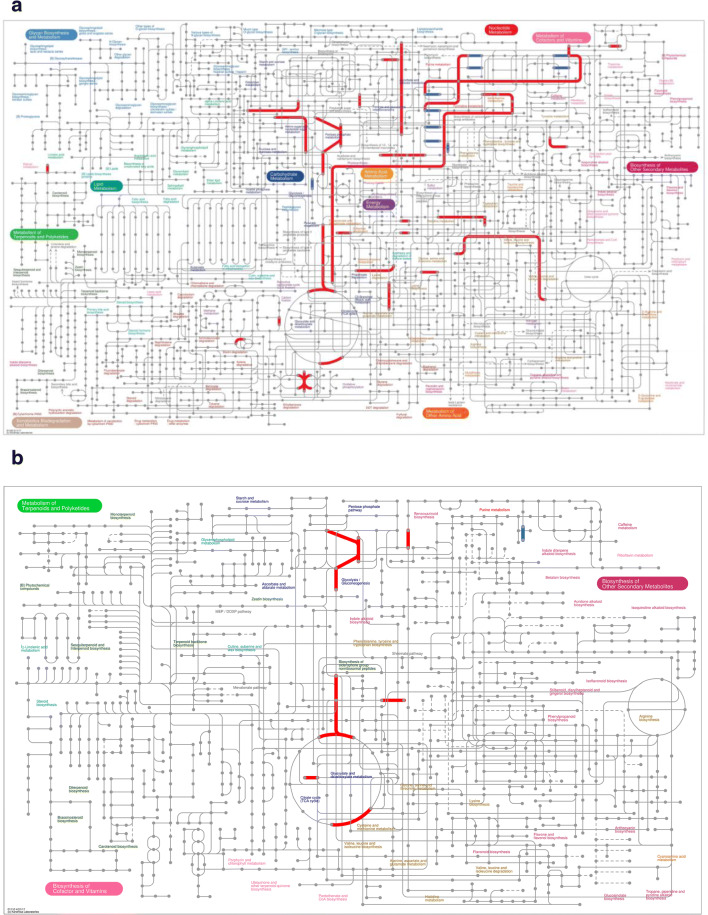
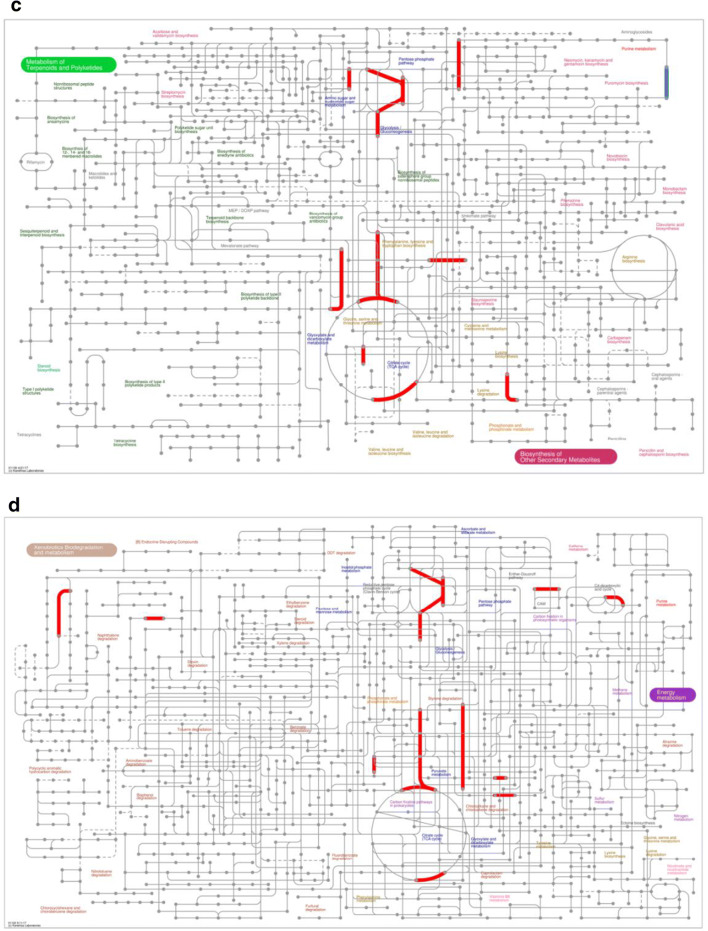
Fig. 4.
iPath analysis of DEGs. Information on (a) metabolic pathways, (b) secondary metabolite biosynthesis, (c) multiple antibiotic synthesis, and (d) microbial metabolic pathways in multiple environments of DEGs was mapped by iPath3.0. The red line represents the pathway affected by the upregulated genes, blue line represents the pathway affected by the downregulated genes, and green line represents the pathway affected by the upregulated and downregulated genes at the same time.


