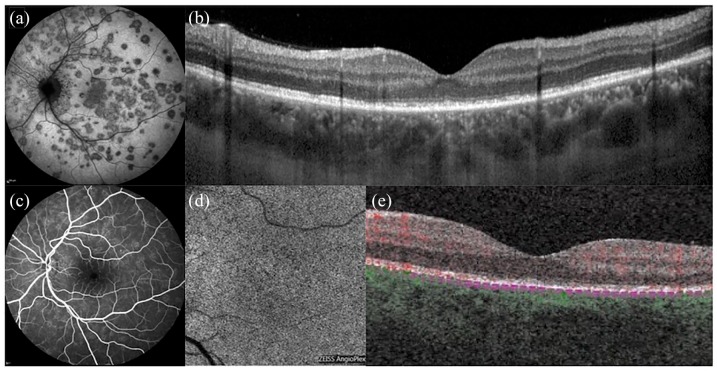
Figure 1.
Multimodal imaging of multiple evanescent white dot syndrome (MEWDS). (a) Indocyanine green angiography illustrates scattered hypocyanescent dots. (b) OCT shows attenuation and irregularities of the ellipsoid zone. (c) Fluorescein angiography reveals minimal hyper-fluorescence with ‘wreath-like’ lesions. (d and e) On OCT angiography, the choriocapillaris slab shows a normal flow signal.

