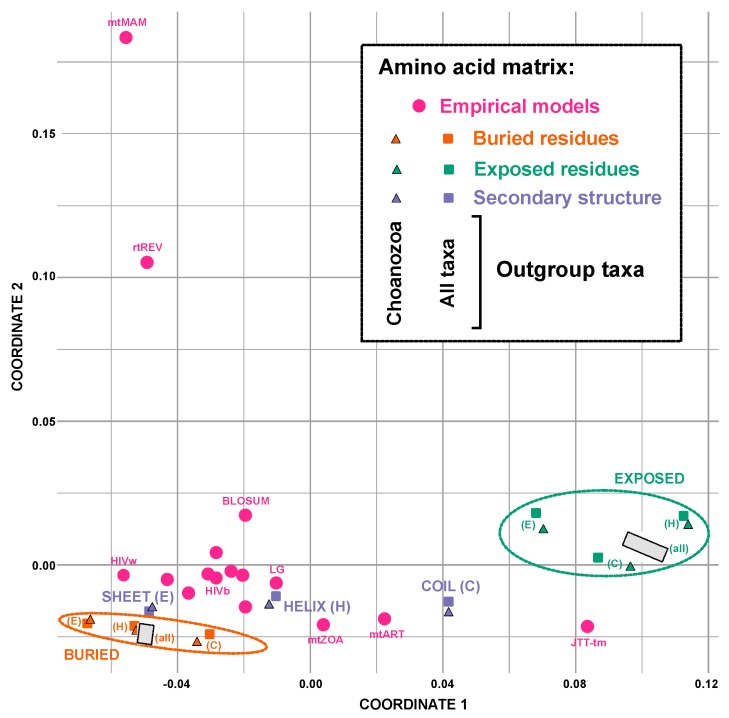
Figure 4.
Multidimensional scaling plot showing the Euclidean distances between various amino acids exchange rate matrices. Different colors indicate different categories of the matrices in the online version (Green: exposed residues, Orange: buried residues, Purple: secondary structure, and Pink: standard empirical models).

