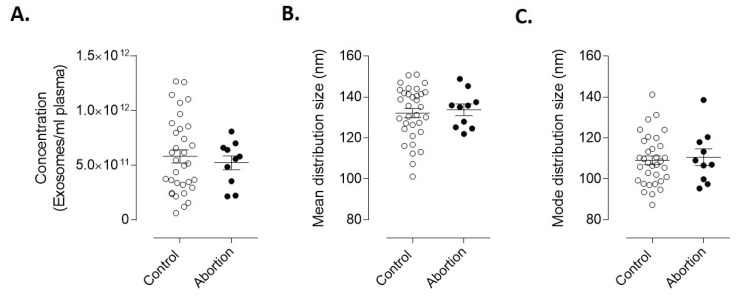
Figure 2.
Concentration of EVs isolated from plasma of controls and spontaneous abortion patients. (A) Mean concentration of extracellular vesicles present in plasma from controls (n = 33) and spontaneous abortion (n = 10). Results are the mean ± SEM. Statistical analyses were performed using Student’s t-test. (B) mean and (C) mode distribution size of total extracellular vesicles isolated from controls (n = 33) and spontaneous abortion (n = 10).

