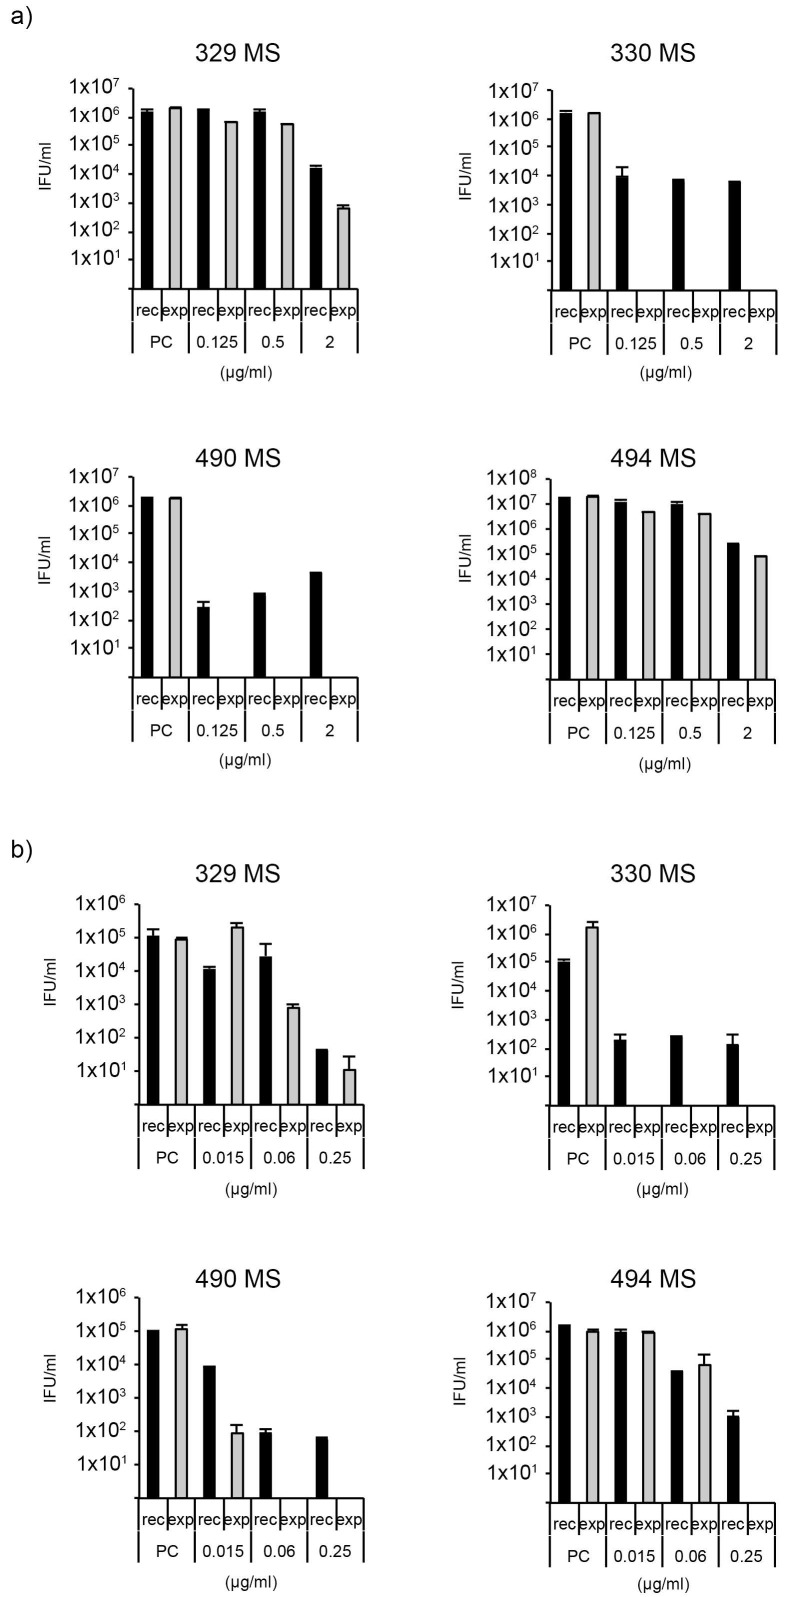
Figure 2.
(a) Tetracycline recovery assay, and (b) doxycycline recovery assay according to Marti et al. [19]. X-axis: concentration of antimicrobials, y-axis: bars showing the number of viable elementary bodies EBs. Each recovery assay was performed once with two technical replicates. PC: positive control, rec: recovery group, exp: continuously exposed group.

