
Figure 1. TMEM159/LDAF1 forms a complex with seipin in the ER.
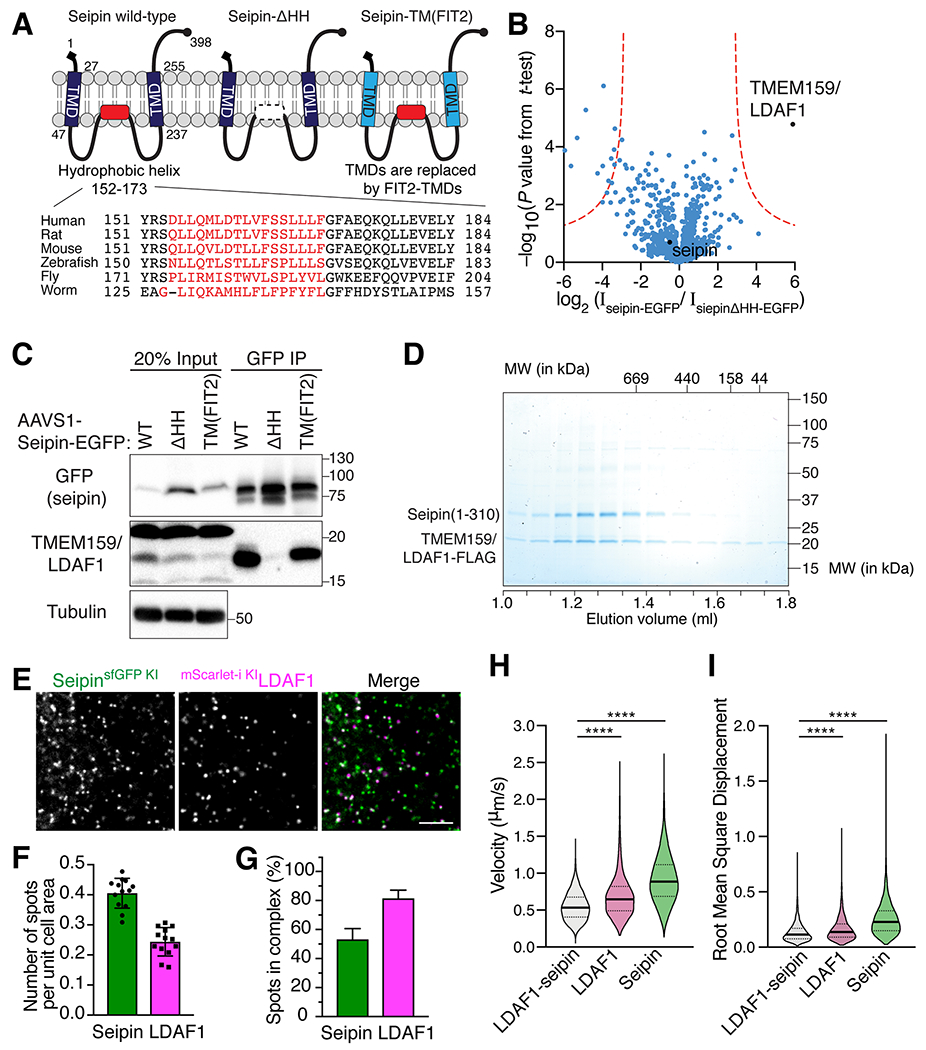
(A) Domain structure of seipin and mutant versions used for the experiment in (B) and (C). Lower panel shows the evolutionary conservation of a hydrophobic helix portion of seipin (red). TMD, transmembrane domain. (B) Volcano plots of proteins associating with seipin-EGFP versus seipin-ΔHH-EGFP; data are from a label-free proteomics analysis of anti-GFP immunoprecipitates from SUM159 seipin KO cells stably expressing seipin-EGFP or seipin-ΔHH-EGFP. Logarithmic ratios of protein intensities are plotted against negative logarithmic P values of two-tailed Student’s t-test, equal variance, performed from n = 3 independent experiments. (C) Immunoblot analysis of the LDAF1-seipin complex in anti-GFP immunoprecipitates from SUM159 cells used for mass-spec analysis shown in (B). (D) Seipin co-purifies and co-migrates with LDAF1-FLAG as a complex on a size fractionation column (Superose 6), as shown by SDS-PAGE analysis of elution fractions. Proteins were visualized by Coomassie blue staining. (E) HILO imaging of live SUM159 cells expressing endogenously fluorescent-tagged seipin (with superfolder GFP) and LDAF1 (with mScarlet-i) at their gene loci. Scale bar, 5 μm. (F) Quantification of number of protein foci shown in (E). (mean ± SD, n = 13 fields of view). (G) Bar graph showing relative fractions analyzed in (F) of seipin or LDAF1 colocalizing with LDAF1 or seipin, respectively. Mean ± SD, n = 13 fields of view. (H and I) Violin plots showing velocity (H) and root mean square distance (I) of seipin and LDAF1 foci analyzed from HILO imaging of live SUM159 cells as in (E), but with simultaneous time-lapse of green and red channels (frame interval = ~ 0.15 sec). Movement of seipin and LDAF1 foci were tracked with FIJI plugin “TrackMate” and analyzed as described in Materials and Methods. Median with interquartile range, p < 0.0001 calculated by an unpaired t-test with Welch’s correction (for non-equal variance).