
Figure 1. Cohort definition and analysis strategy.
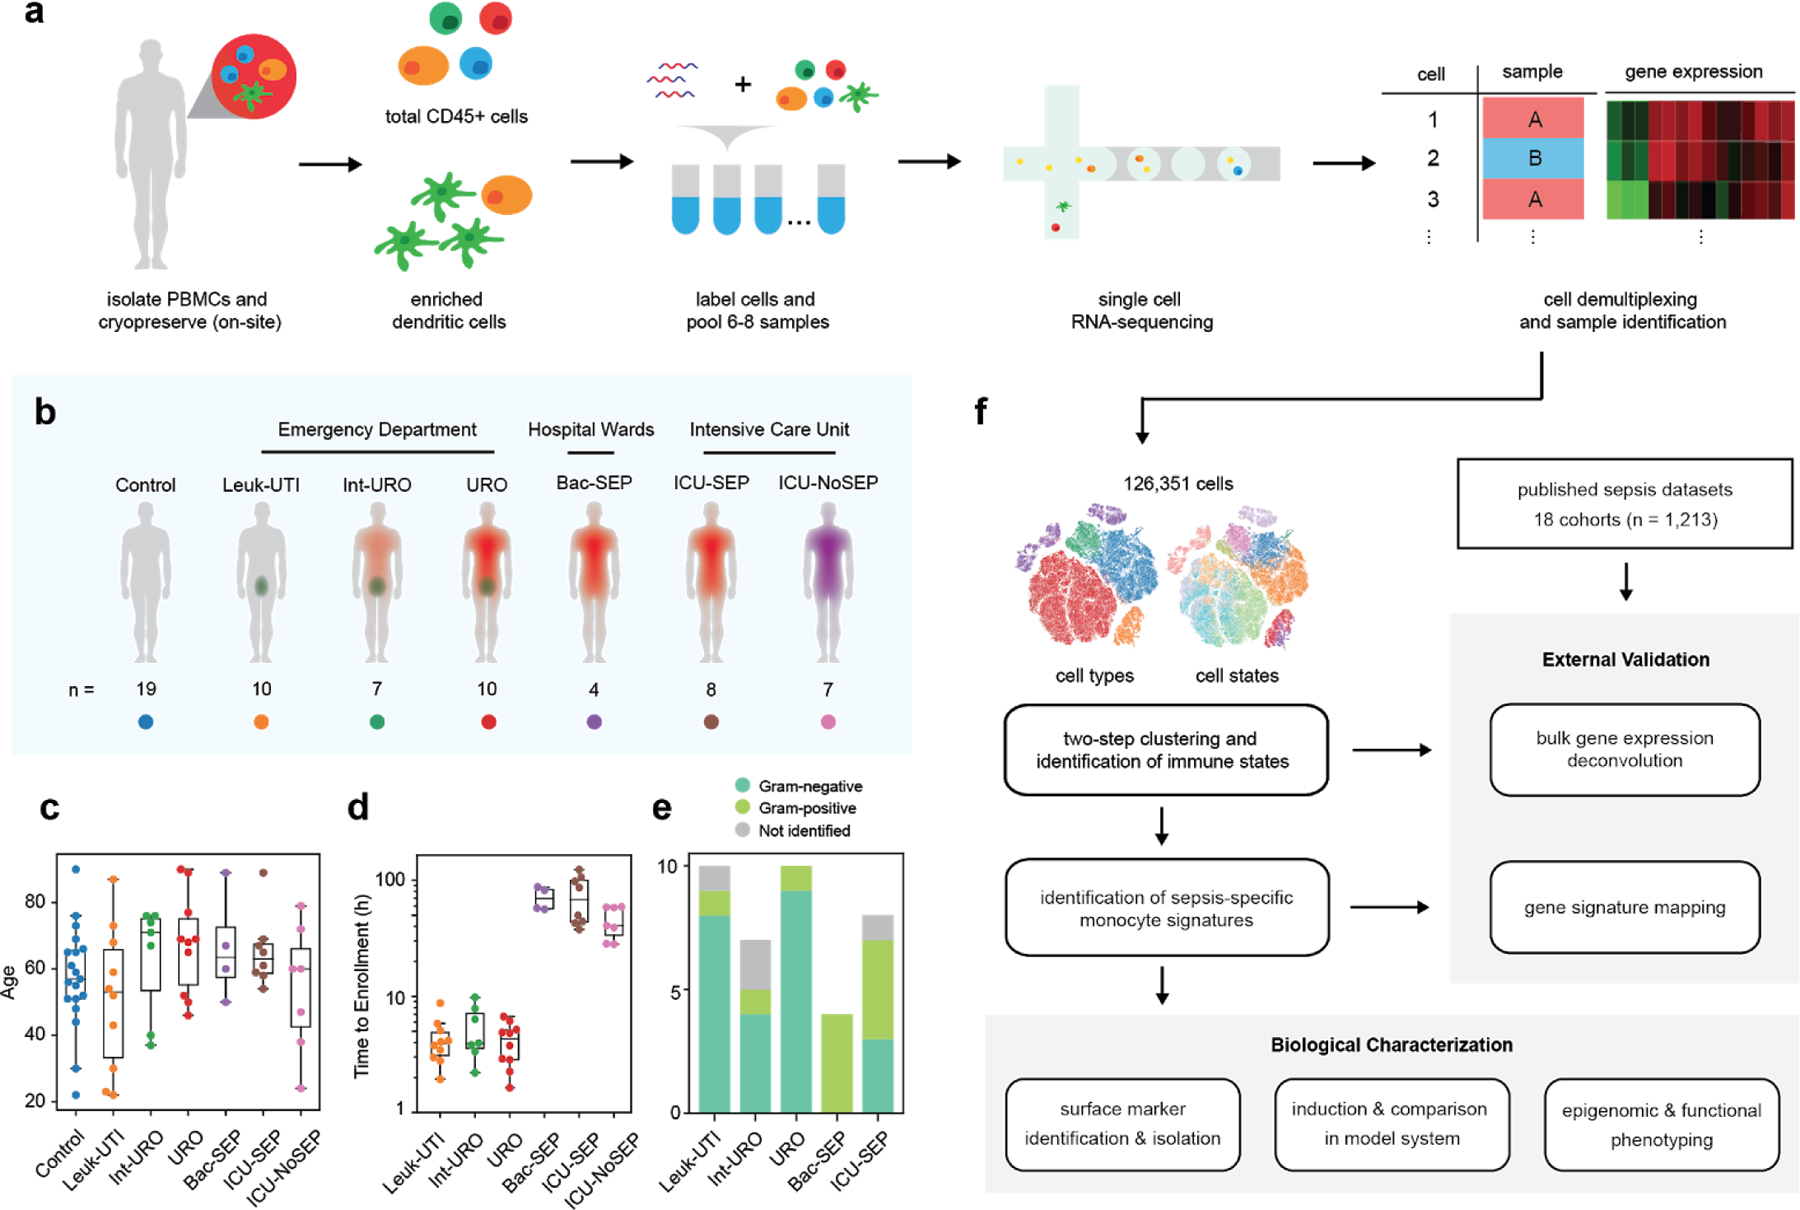
(a) Processing pipeline for blood samples used in this study. Total CD45+ PBMCs and enriched dendritic cells for groups of patients were labelled with cell hashing antibodies and loaded on a droplet-based scRNA-seq platform. Cells were demultiplexed and multiplets were removed based on calls for each barcoding antibody. (b) Schematic and number of patients for each cohort profiled in this study. (c) Age distribution of patients and controls analyzed in this study. (d) Time to enrollment from hospital presentation for each patient across all cohorts. Boxes show the mean and interquartile range (IQR) for each patient cohort, with whiskers extending to 1.5 IQR in either direction from the top or bottom quartile. (e) Barplots showing fractions of Gram-positive and Gram-negative pathogens for each cohort. (f) Analysis pipeline: cell states were identified via two-step clustering, and fractional abundances thereof were compared to find sepsis-specific states. Further signatures were derived from these states using differential gene expression and gene module analysis. These signatures were validated in external sepsis datasets via a combination of bulk gene expression deconvolution, direct mapping of gene signatures, and meta-analysis. Experiments were performed to identify surface markers, develop a model system for induction, analyze the epigenomic profile, and characterize the functional phenotype of the identified cell state.