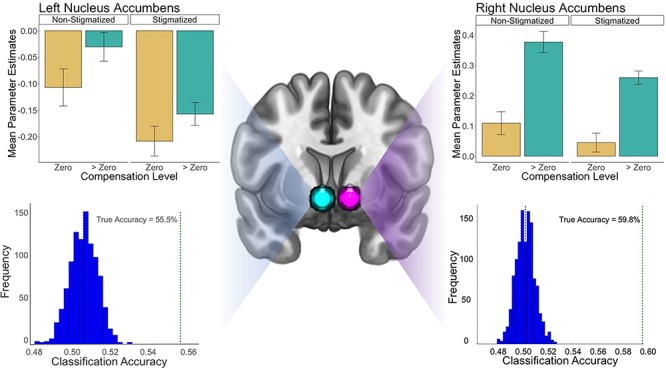
Fig. 3.

Results from analyses in the left and right NAcc during anticipation. For both the left and right ROIs, the top graphs show the results from univariate analyses contrasting the stigmatizing and non-stigmatizing conditions. The bottom graphs show results from permutation tests of the multivariate pattern classification analysis, which indicate that stigmatization did influence representation of incentives in both NAcc ROIs. None of the permutations (histogram of accuracy scores with permuted condition labels in blue) achieved accuracy greater than or equal to the classification accuracy with the true labels (indicated by the green dotted line).
