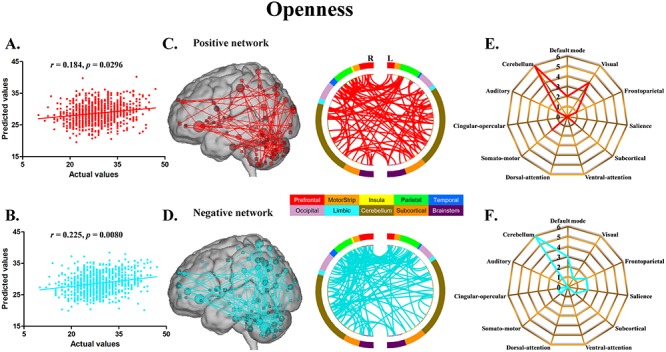
Fig. 2.

CPM of openness. (A, B) Scatter plots showing the correspondence between actual (x-axis) and predicted (y-axis) openness values generated using CPM based on the positive and negative networks. (C, D) High-degree nodes (degree ≥4, larger spheres indicate nodes with higher degree) and their connections in the positive and negative networks. (E, F) Polar plots illustrating the 20 highest degree nodes summarized by overlap with canonical neural networks in the positive and negative networks.
