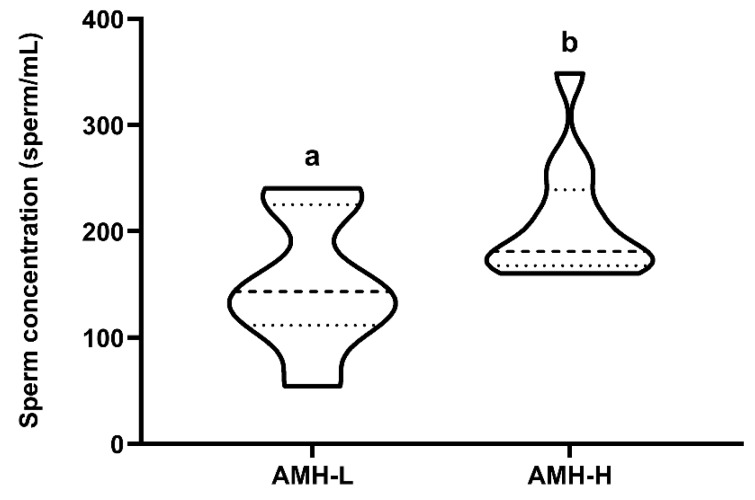
Figure 2.
Relationship between concentration (ng/mL) of the anti-Müllerian hormone in boar seminal plasma (SP-AMH) and sperm concentration (sperm/mL). Violin plots represent levels and distribution of sperm concentration in boars hierarchically grouped (p ˂ 0.001) as having low- (AMH-L; ranging from 479.92 to 701.84 ng/mL, n = 7) or high- (AMH-H; ranging from 770.53 to 1096.72 ng/mL, n = 19) SP-AMH concentration. Dashed line represents the median and dotted lines the 25 and 75% quartiles. Different superscript letters (a–b) indicate significant differences between SP-AMH groups (p ˂ 0.05).

