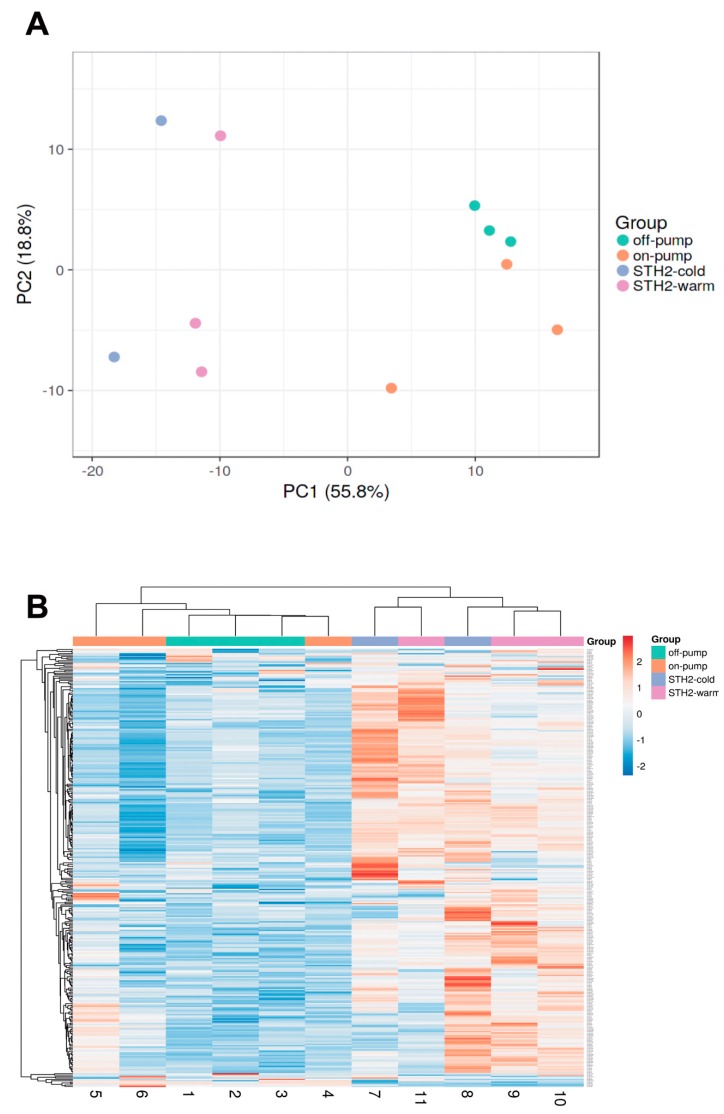
Figure 5.
Principle component analysis on microRNA expression. (A) Principal component analysis on microRNA expression (n = 212, TPM) > 1) within left ventricular tissue of pigs from on-pump, off-pump, STH2-warm and STH2-cold groups. (B) Heat map and cluster analysis (Euclidean distance) of 212 commonly expressed miRNAs. n = 3–6/groups. PC: principal component. TPM: tags per million

