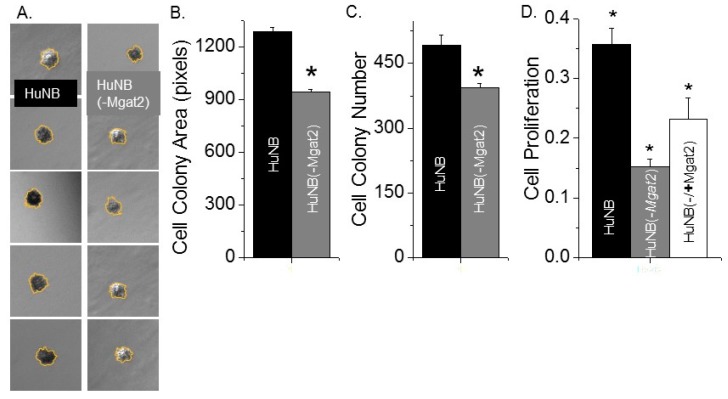
Figure 3.
Increased levels of hybrid and oligmannose types of N-glycans reduced HuNB cell growth. Typical DIC micrographs of cell colonies of HuNB (left panels) and HuNB(-MGAT2) (right panels) cell lines from the anchorage-independent cell growth assay (A). Bar graphs show the mean cell colony areas (B), and cell colony number per experiment (C) of each cell line from 3 experiments. * p < 0.02. The cell-attached proliferation assay was conducted three times in triplicate for the various NB cell lines (D). Mean differences were compared using one-way analysis of variance (ANOVA) followed by Bonferroni’s post-hoc tests. A value of p < 0.05 was considered significant (*).

