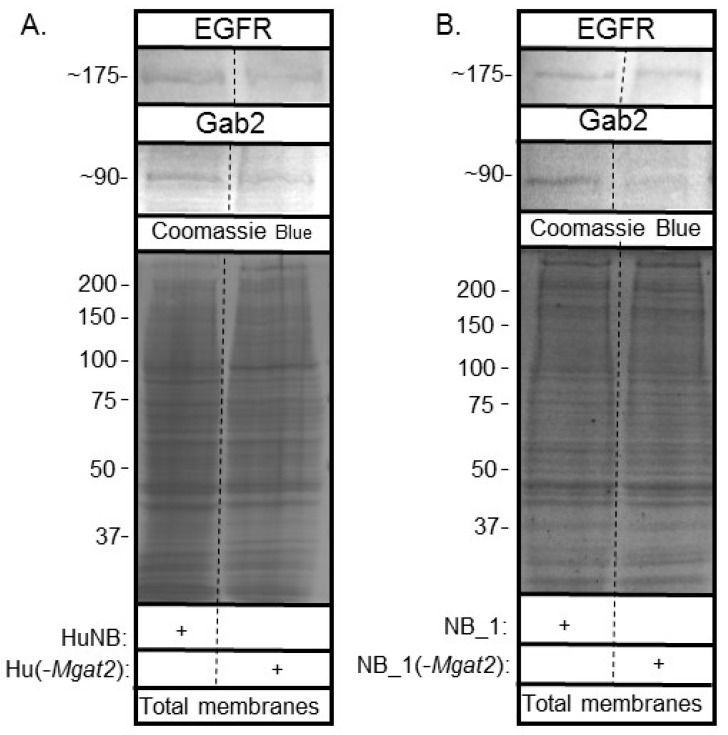
Figure 9.
Lowered complex type N-glycans by NB cells altered EGFR and Gab2 protein levels. Western blots of EGFR (top panels) and Gab2 (middle panels) of total membranes from parental and mutant human (A) and rat (B) cell lines, as indicated. Coomassie blue stained gels (bottom panels) show that equal amounts of protein were loaded. Relative molecular weights (in KDa) of EGFR and Gab2 are next to western blots. Molecular weights (in KDa) of standards are adjacent to coomassie blue stained gel. Experiments were performed three times.

