
Figure 4.
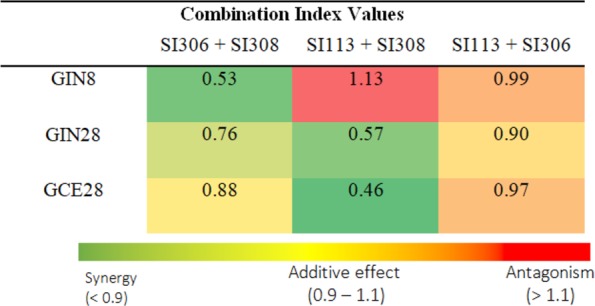
Combination index values. Compounds were applied at a molar ratio of 1:1. Shown is a summary of the CI values for the combinations of kinase inhibitors following 48 h incubation in three GBM lines. Each CI value was calculated, and a heat map was generated on the basis of three independent IC50 experiments (n = 3). Values represent the mean ± SD.