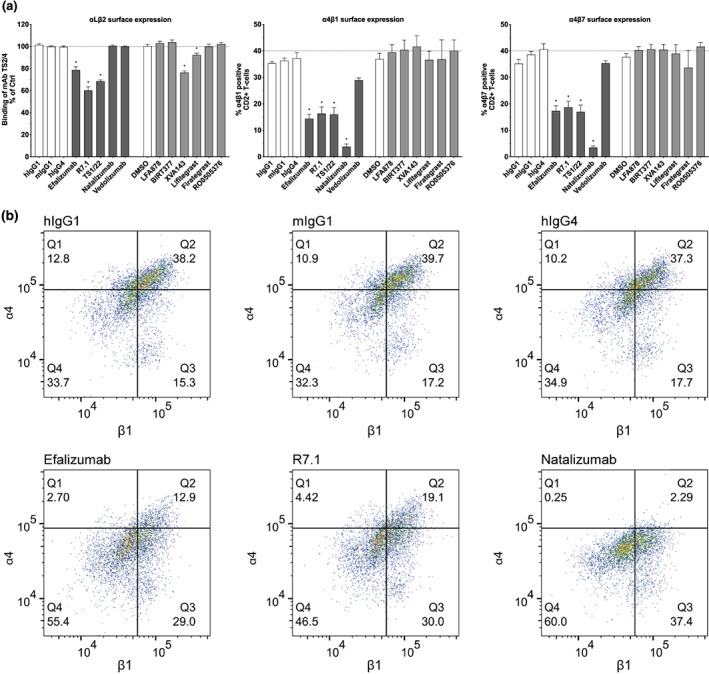
Figure 2.

Effect of mAbs and compounds on integrin αLβ2, α4β1, and α4β7 surface expression. (a) Surface expression of αLβ2, α4β1, and α4β7 on CD2+ T cells after 24 hr of treatment with anti‐αL (efalizumab, R7.1, and TS1/22), anti‐α4 (natalizumab), anti‐α4β7 (vedolizumab) mAbs (all 10 μg·ml−1), small‐molecule inhibitors targeting αL (LFA878 and BIRT377), αLβ2 (XVA143 and lifitegrast), and α4β1/α4β7 (firategrast and RO0505376; all 10 μM) and respective controls. Each bar represents the mean value ± SEM of five independent experiments using blood samples from different donors. Statistical significance was determined by using one‐way ANOVA, *P < .05, versus control. (b) Flow cytometry dot plots of α4β1 CD2+ T cells. Representative flow cytometry dot plots of CD2+ T cells treated for 24 hr with efalizumab, R7.1, natalizumab and respective isotype controls are shown. Dots in the upper right quadrant indicate α4β1 positive CD2+ T cells. The samples were acquired using a Cytoflex cytometer and analysed using FlowJo software
