
FIGURE 5.
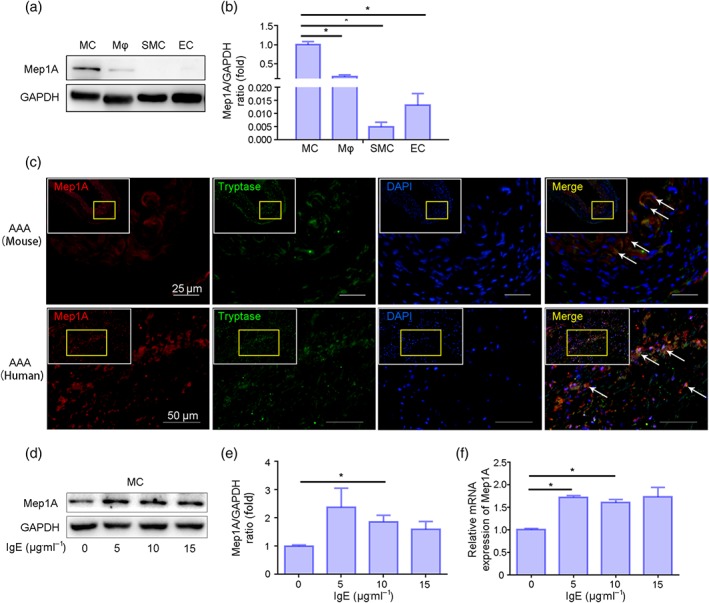
IgE up‐regulated Mep1A expression in mast cells (MCs). (a) Immunoblot analysis of basal Mep1A expression in the indicated cells including mast cells, macrophages (Mϕ), smooth muscle cells (smooth muscle cell) and endothelial cells (ECs). (b) Quantification of Mep1A expression in the indicated cells by immunoblotting. (c) Immunofluorescence staining of Mep1A and tryptase (mast cell marker). Mep1A: red, tryptase: green, DAPI: blue. (d) Immunoblot analysis of Mep1A expression in MCs treated with IgE at the indicated doses. (e) Quantification of immunoblotting results of Mep1A expression in MCs treated with IgE. (f) RT‐PCR analysis of Mep1A expression in MCs treated with the indicated doses of IgE. Data are presented as the mean ± SEM of five independent experiments. One‐way ANOVA was conducted to examine the differences among groups for all data. *P <.05 was considered statistically significant