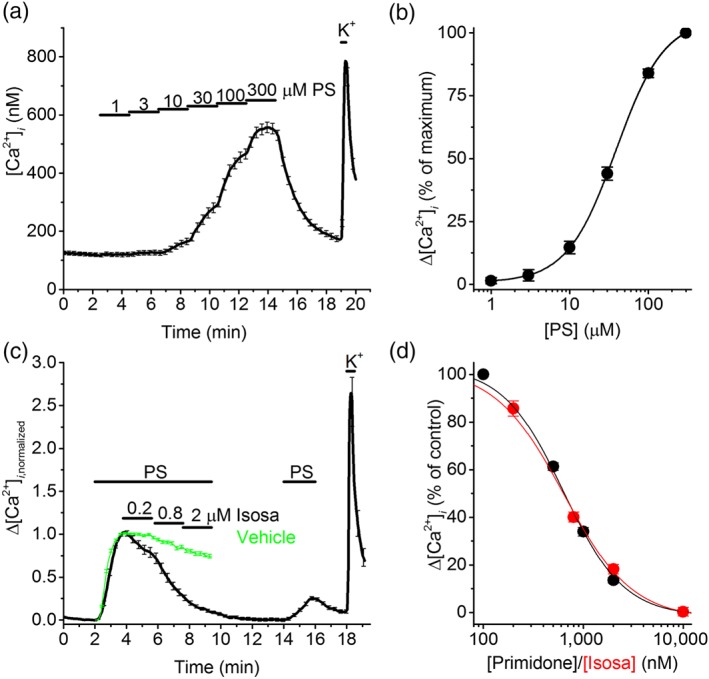
Figure 5.

Pharmacological characterization of TRPM3 in human stem cell‐derived sensory neurons (hSCDS) neurons. (a) Time course of the intracellular Ca2+ concentration in PS responding hSCDS neurons upon increasing the concentration of pregnenolone sulphate (PS) from 1 to 300 μM. (b) Concentration dependence of the PS‐induced calcium response in hSCDS neurons. Responses were normalized to the maximal response (n = 117). Solid line represents a fit using a Hill function. (c) Normalized calcium traces showing the effect of increasing concentrations of the TRPM3 antagonist isosakuranetin (Isoas) on the response to PS (40 μM). Green trace represents the vehicle control, showing mild rundown of the signal in the absence of antagonist. (d) Concentration–response curve for the inhibition of PS‐evoked calcium responses by isosakuranetin (n = 93; red squares) and primidone (n = 61; black dots). The mean normalized calcium response of vehicle‐treated hSCDS neurons (green trace in panel (c)) was used as control. Solid line represents a fit using a Hill function [Colour figure can be viewed at http://wileyonlinelibrary.com]
