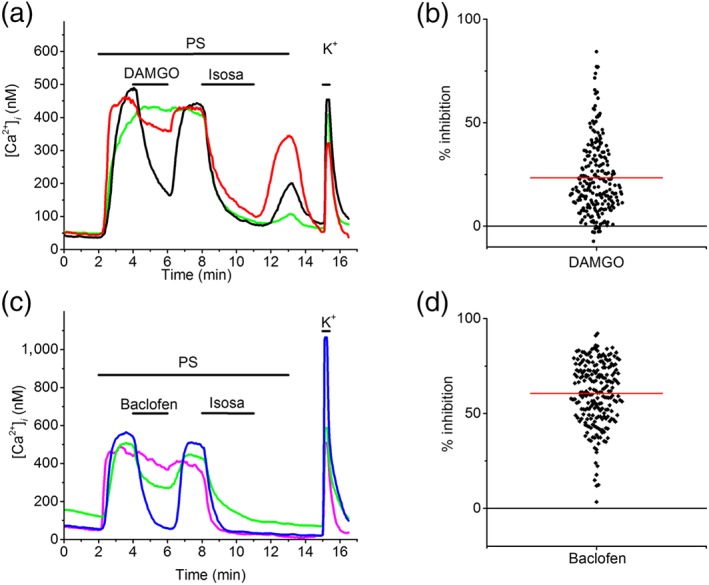
Figure 6.

Modulation of TRPM3 in human stem cell‐derived sensory neurons (hSCDS) neurons by GPCRs. (a) Example intracellular calcium measurements showing variable degrees of inhibition of PS‐induced responses upon activation of endogenously expressed μ‐opioid receptors using DAMGO (300 nM). (b) Scatter plot showing the range of DAMGO‐induced inhibition of PS responses in hSCDS neurons. Red line represents the mean percentage of TRPM3 inhibition caused by DAMGO (data from six experiments, with hSCDS neurons from three different differentiations). (c) Example intracellular calcium traces showing inhibition of PS‐induced responses by the GABAB receptor agonist baclofen (25 μM). (d) Scatter plot showing the range of baclofen‐induced inhibition of PS. Red line represents the mean percentage of inhibition caused by baclofen (data from six experiments, with hSCDS neurons from two different differentiations) [Colour figure can be viewed at http://wileyonlinelibrary.com]
