
Figure 7.
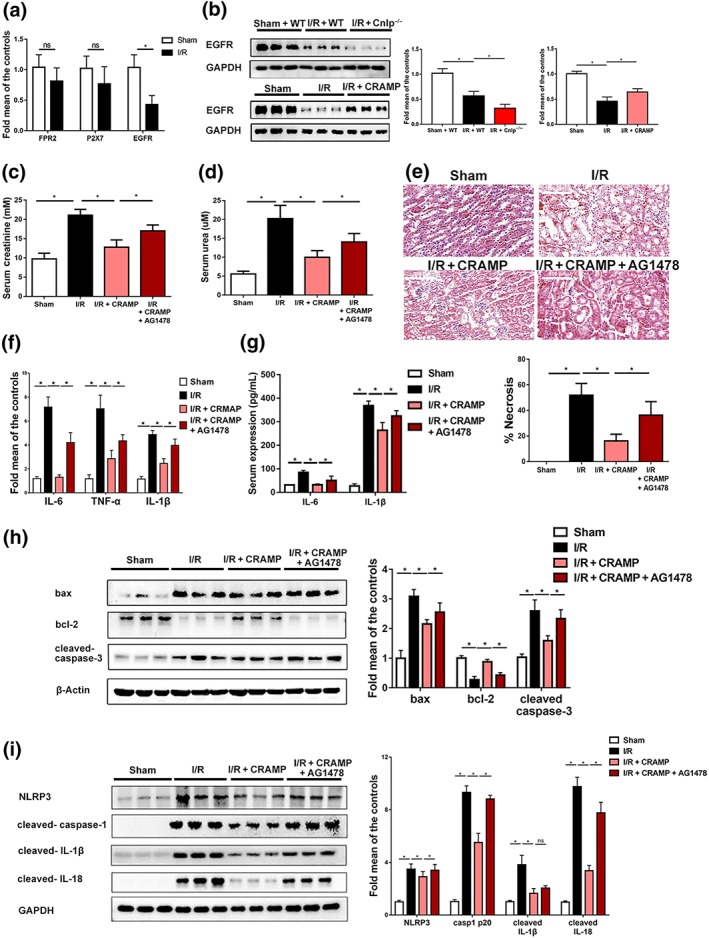
CRAMP protects renal I/R through EGFR. (a) The mRNA levels of CRAMP receptors (including FPR2, P2X7, and EGFR) after renal I/R measured by real‐time PCR in kidneys (n = 8 per group). Grouped t test was used. (b–i) Mice were treated with CRAMP (5 mg·kg−1) at 1 hr before I/R. AG1478 was administered 30 min before CRAMP treatment. (b) EGFR expression determined by Western blot and densitometry analyses. (c) Serum creatinine (n = 8 per group). (d) Serum urea (n = 8 per group). (e) Representative histological sections and quantification of necrosis in tubular epithelial cells (n = 8 per group). Scale bar: 100 μm. (f) The mRNA levels of proinflammatory cytokines (IL‐6, TNF‐α, and IL‐1β) in the kidneys (n = 5 minimum per group). (g) Serum levels of IL‐6 and IL‐1β (n = 8 per group). (h) Western blot and densitometry analyses of NLRP3 inflammasome activation in kidney tissues. (i) Western blot and quantitative analysis of Bax, Bcl‐2, and cleaved caspase‐3 in kidney tissues, β‐actin or GAPDH was used as loading control (n = 8 per group). The results are shown as mean ± SEM. *P < .05, significantly different as indicated; one‐way ANOVA followed by Tukey's test [Colour figure can be viewed at http://wileyonlinelibrary.com]