Figure 4.

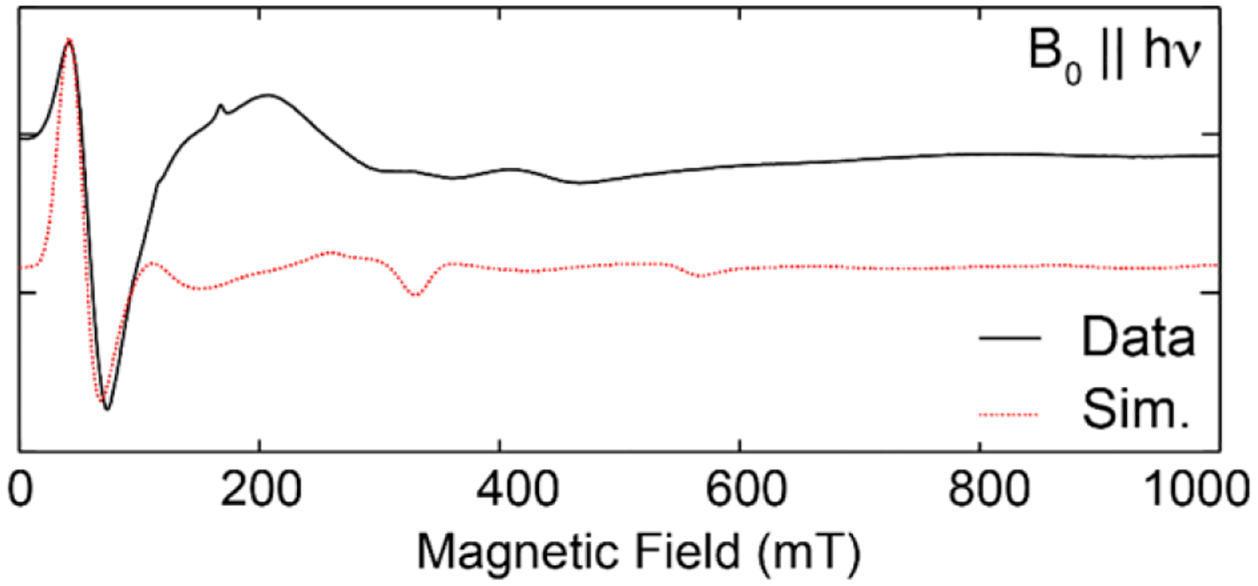
Parallel mode X-band CW-EPR of complex 3. Spectral data are shown in black and the simulated spectrum is represented by the dashed red line. Simulation parameters: S = 3, g = 1.97, D = 0.4 cm−1, E/D = 0.1.

Parallel mode X-band CW-EPR of complex 3. Spectral data are shown in black and the simulated spectrum is represented by the dashed red line. Simulation parameters: S = 3, g = 1.97, D = 0.4 cm−1, E/D = 0.1.