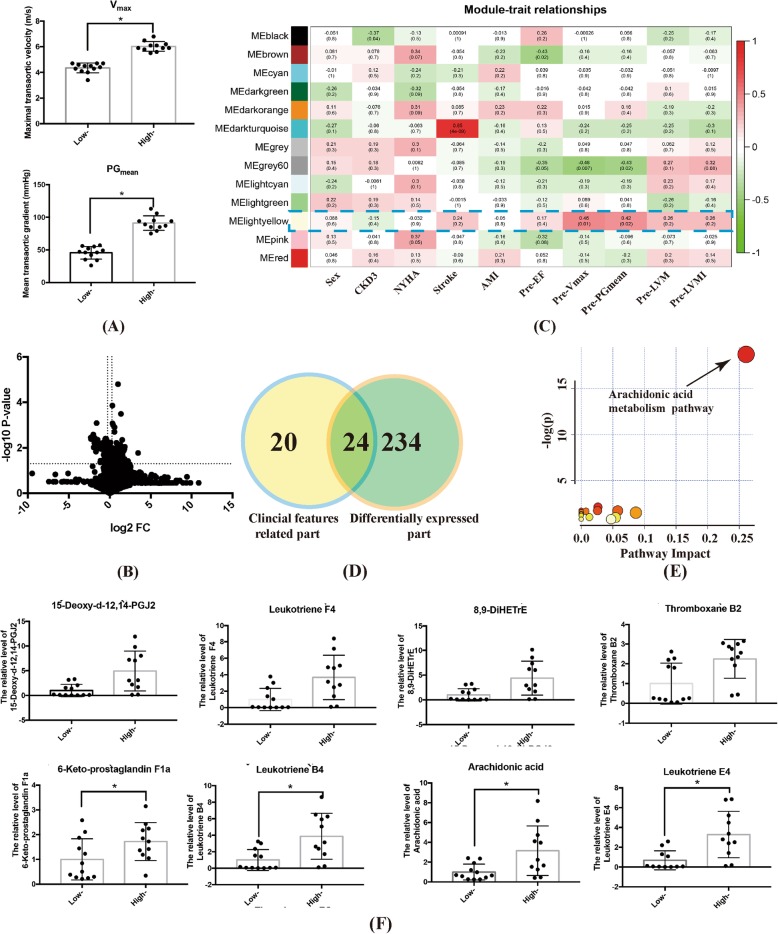
Fig. 4.
Baseline subgroup analysis for BAV patients. a Baseline hemodynamics in lower and higher baseline Vmax groups. (* indicated p-value< 0.05). b Comparison of all metabolites between the lower and higher Vmax groups by volcano plot. c WGCNA algorithm identified the metabolic module closely related to baseline Vmax. d Venn plot indicated the impact metabolites which both were positively related to baseline Vmax and differentially expressed between BAV and TAV. e Pathway enrichment analysis detected the significantly altered arachidonic acid metabolism pathway (p-value< 0.05). f The different expression of metabolites in arachidonic acid metabolism pathway between patients with lower and higher baseline Vmax (* indicated p-value< 0.05)

